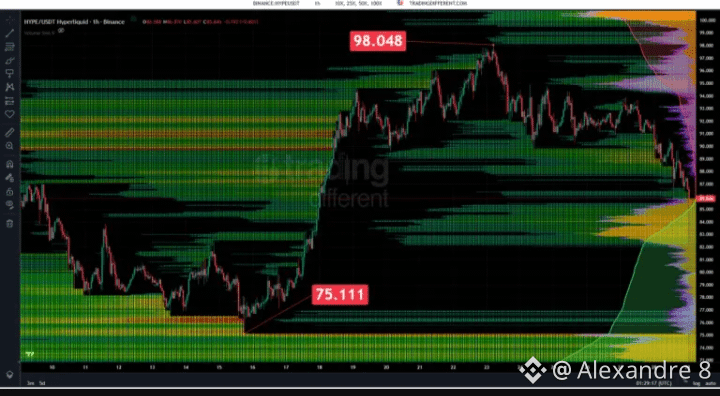
📊 Hyperliquid ($HYPE): What the Heatmap Reveals After the ATH?
Hyperliquid closed September with a gain of over 260% year-to-date. However, the recent price action shows an important transition between phases in the futures market.
📈 1. The Search for Sellers’ Liquidity (Shorts) The first leg climbed 70.71% in 35 days, reaching the all-time high of $98.05 before the spot listing on Binance. The move hunted for and exhausted the liquidity of leveraged short positions.
📉 2. Flow Reversal: Liquidation of Buyers (Longs) After trading sideways between $90 and $94, the price broke supports on September 28 and moved toward the dense lower liquidity blocks. Each long liquidation acts like a forced sell, accelerating the drop.
🎯 3. Key Liquidity Levels on the Chart • 1H View (Short Term): $82.97 (range between $81.00 and $85.50). • 4H View (Medium Term): Intermediate levels at $74.97 and $65.51. • Main Zone: Maximum liquidity concentration at $47.39. • Upper Resistance: Short liquidity concentrated from $100.52+.
💡 Strategy: With volume falling ~49% versus the monthly average, the derivatives market is cleaning up excessive leverage. Wait for confirmation of support in the lower blocks before opening new positions.
$HYPE
#Write2Earn!
#Hyperliquid
#HYPE
#BinanceSquare
Hyperliquid closed September with a gain of over 260% year-to-date. However, the recent price action shows an important transition between phases in the futures market.
📈 1. The Search for Sellers’ Liquidity (Shorts) The first leg climbed 70.71% in 35 days, reaching the all-time high of $98.05 before the spot listing on Binance. The move hunted for and exhausted the liquidity of leveraged short positions.
📉 2. Flow Reversal: Liquidation of Buyers (Longs) After trading sideways between $90 and $94, the price broke supports on September 28 and moved toward the dense lower liquidity blocks. Each long liquidation acts like a forced sell, accelerating the drop.
🎯 3. Key Liquidity Levels on the Chart • 1H View (Short Term): $82.97 (range between $81.00 and $85.50). • 4H View (Medium Term): Intermediate levels at $74.97 and $65.51. • Main Zone: Maximum liquidity concentration at $47.39. • Upper Resistance: Short liquidity concentrated from $100.52+.
💡 Strategy: With volume falling ~49% versus the monthly average, the derivatives market is cleaning up excessive leverage. Wait for confirmation of support in the lower blocks before opening new positions.
$HYPE
#Write2Earn!
#Hyperliquid
#HYPE
#BinanceSquare