


Oracle stock staged one of its sharpest single-session moves in recent weeks on Tuesday, September 29, 2026. Shares closed at $137.79, up 3.91%. The daily structure remains firmly bearish, however, and the bounce must be read inside that context rather than as a reversal signal.
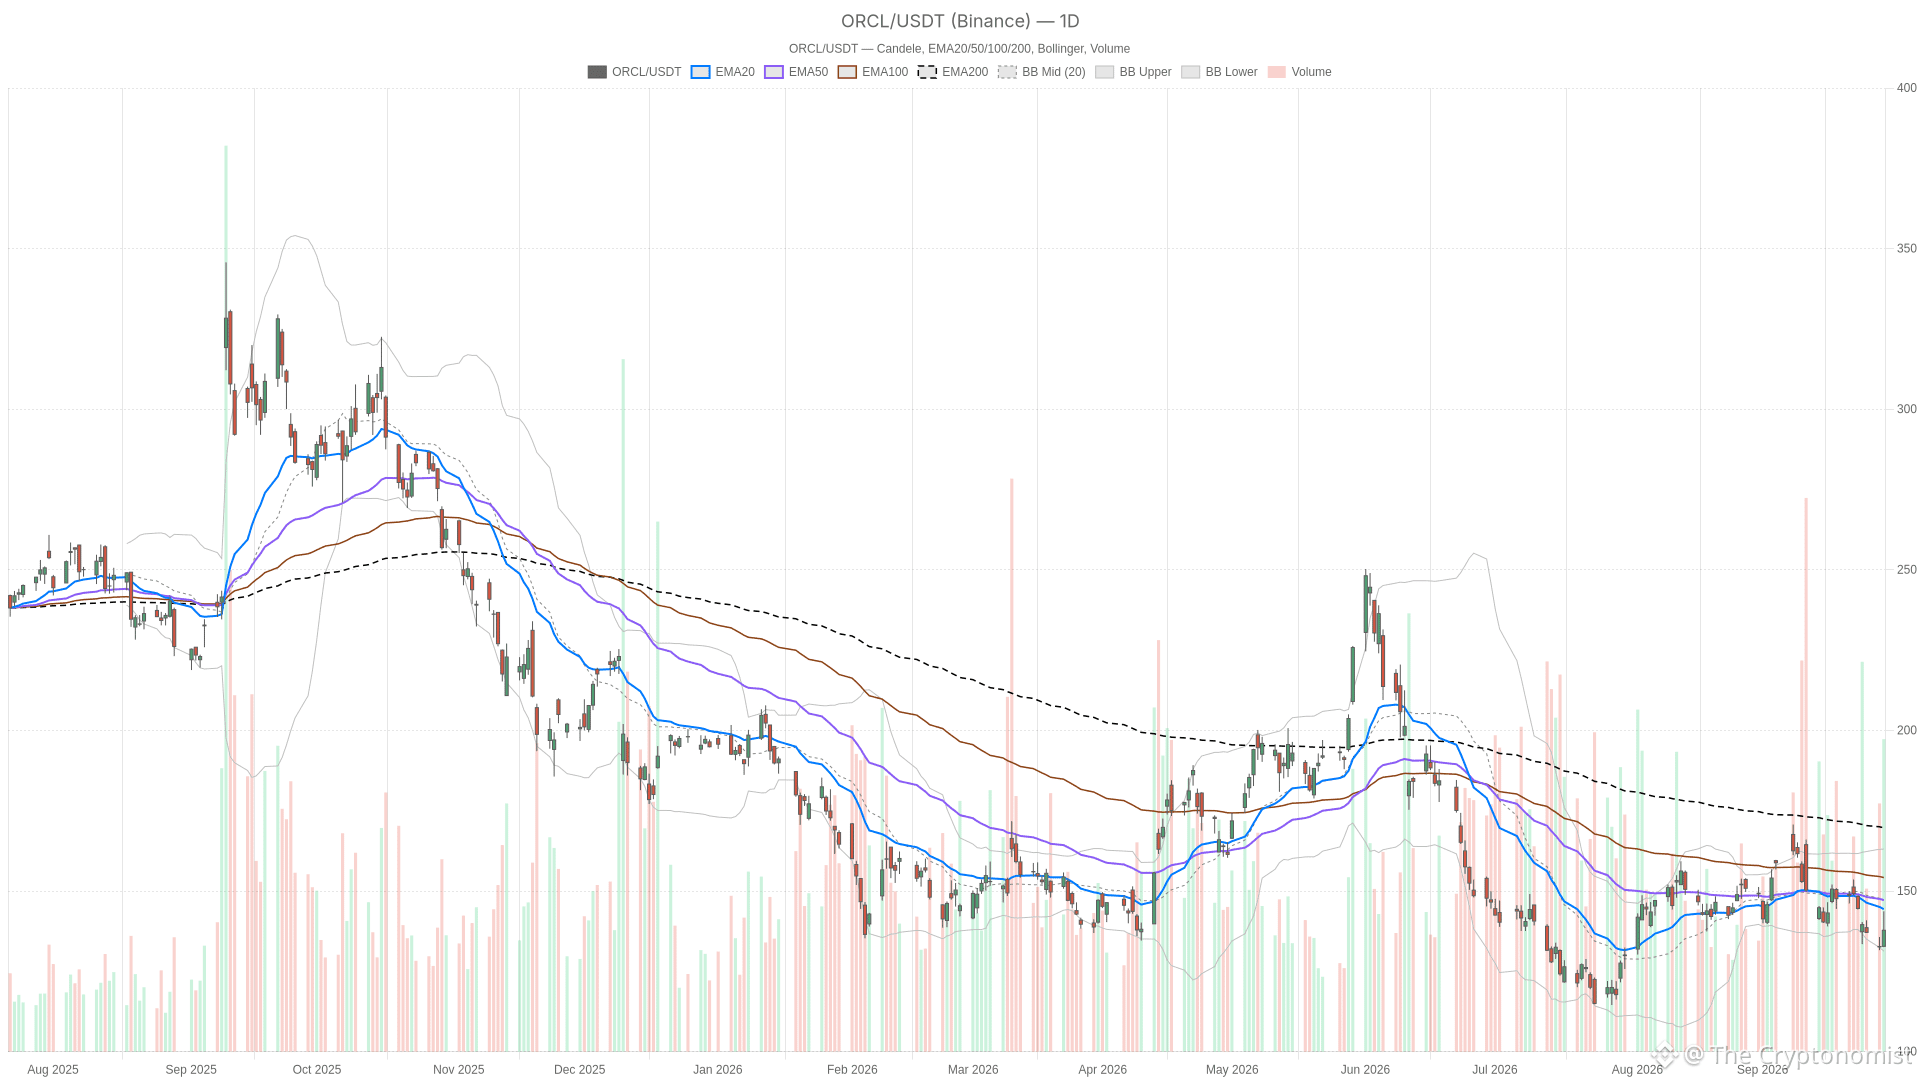 ORCL — daily chart with candlesticks, EMA20/EMA50 and volume.
Key takeaways
Oracle stock closed at $137.79 on Tuesday, September 29, 2026, gaining 3.91% in a sharp single-session bounce.
The daily chart remains bearish, with price below the 20-day EMA at $144.35, 50-day EMA at $147.15, and 200-day EMA at $175.62.
Daily RSI14 at 43.07 and MACD histogram at -1.81 confirm bearish momentum is still intact despite the rally.
Oracle’s $664 billion in remaining performance obligations, fueled by over $30 billion in new AI cloud contracts, provides fundamental support.
Bearish risks include negative free cash flow concerns flagged during Tuesday’s session and bond yields near 8%, as flagged in an after-hours report.
Daily Chart: Oracle Stock Remains in a Bearish Structure
Oracle stock remains firmly bearish on the daily chart, trading below all three major exponential averages in a stacked bearish alignment.
EMA Stack Confirms the Downtrend
Oracle stock is trading below all three major exponential averages on the daily timeframe, and the order itself is telling. Price at $137.79 sits under the 20-day EMA at $144.35. That average sits under the 50-day EMA at $147.15, which sits under the 200-day EMA at $175.62. This stacked bearish alignment is the technical signature of a stock still in a downtrend, even after a strong up day.
Momentum Indicators Still Favor the Bears
Momentum confirms the same picture. The daily RSI14 reads 43.07, below the neutral 50 line. Buyers have not yet regained control despite Tuesday’s rally. The MACD line sits at -2.44, well under its signal line at -0.62, with a histogram of -1.81. In other words, the bearish momentum gap is still wide open. One strong session was not enough to close it.
Volatility, Range, and Pivot Levels
The daily candle itself was violent. It opened at $132.79, hit a high of $143.67, touched a low of $132.54, and closed at $137.79 on volume of roughly 45.4 million shares. The wide swing closed well off the session high. This suggests sellers stepped back in after the initial push.
The Bollinger Bands frame this clearly. The mid-band sits at $147.16 and the lower band at $131.29. Price is still hugging the lower half of the range rather than pushing toward the mean. The daily ATR14 of $7.28 confirms that single-session ranges remain unusually wide for this stock right now.
Pivot levels add useful context for where the tug-of-war is happening. The daily pivot point sits at $138, with resistance at $143.46 (R1) and support at $132.33 (S1). Tuesday’s close landed almost exactly on the pivot. That is a fair description of the current stalemate. Neither bulls nor bears have taken clear control at this level.
Hourly Momentum: A Tentative Stabilization
The hourly chart shows early signs of short-term stabilization for Oracle stock, though it does not overturn the bearish daily structure.
The 1-hour timeframe softens the bearish daily picture somewhat, though it does not overturn it. Price at $137.90 has reclaimed the 20-hour EMA at $137.61. However, it remains below the 50-hour EMA at $140.55 and the 200-hour EMA at $144.92. Those two longer hourly averages are still stacked in bearish order. The medium-term hourly trend has not flipped. Still, the fact that price is back above the fastest average is a first sign of short-term stabilization.
RSI14 sits at 48.81, essentially neutral. The MACD histogram has turned positive at 0.72. However, the MACD line itself, at -0.87, remains below its signal line at -1.60. That combination — a still-negative MACD line but a positive histogram — typically points to fading downward momentum rather than a confirmed bullish turn.
Meanwhile, the hourly pivot sits at $138.02. Resistance stands at $138.33 and support at $137.60. Price is trapped in a very narrow band right around that pivot, reinforcing the sense of indecision.
This is where the timeframes genuinely disagree. The daily chart says downtrend; the hourly chart says short-term pause with early signs of life. Neither view cancels the other out. It simply means Oracle stock is bouncing inside a larger bearish structure. That is a very different setup from a trend reversal.
15-Minute View: Execution Context
The 15-minute chart for Oracle stock shows a mixed, consolidating picture rather than a clean trend, offering limited conviction for short-term entries.
On the 15-minute chart, price at $137.90 sits almost on top of its 20-period EMA at $137.85. It is above the 50-period EMA at $137.24 but below the 200-period EMA at $140.35. That is a mixed, consolidating picture rather than a clean trend.
RSI14 at 52.44 is mildly constructive. However, the MACD histogram has slipped to -0.17 after the line crossed below its signal (0.42 versus 0.59). This suggests the sharpest part of the bounce has already cooled off intraday. For anyone timing entries, this argues for patience around the $138 pivot rather than chasing the move.
Bullish Scenario: What Would Support a Real Recovery
For Oracle stock to stage a genuine recovery, it would need to clear key daily resistance levels while hourly momentum confirms the turn.
For the bullish case to gain real traction, Oracle stock would need to close back above the daily pivot at $138. It would then have to work through resistance at $143.46. A reclaim of the 20-day EMA at $144.35 would be the next meaningful signal. It would suggest the daily downtrend is genuinely losing force, not just pausing.
On the hourly chart, confirmation would come from a MACD line crossing back above its signal line. RSI pushing convincingly above 50 would add further weight.
Fundamentally, the case draws support from Oracle’s reported $664 billion in remaining performance obligations. That figure is fueled by more than $30 billion in new AI cloud contracts. Yahoo Finance framed this as boosting multi-year revenue visibility despite heavy capital spending.
A Seeking Alpha piece published the same day also argued the stock is a buy after what it described as a 55% decline. It pointed to a $24 billion cash gap between capital expenditures and operating cash flow. The piece framed that gap as the source of the valuation discount rather than a reason to avoid the name.
Bearish Scenario: What Would Invalidate the Bounce
The bearish case for Oracle stock remains the default until proven otherwise, with clear invalidation levels below current price.
The bearish case remains the default until proven otherwise. A failure to hold above the daily support at $132.33 would open the door back toward the lower Bollinger Band at $131.29. From there, the path of least resistance stays down. The MACD histogram on the daily chart is still widening.
The distance between current price and the 200-day EMA at $175.62 is telling. It illustrates how far Oracle stock has already fallen from its longer-term trend. That gap does not close quickly.
Notably, an after-hours Yahoo Finance report flagged concerns about Oracle’s bond yields near 8%. The report described this as an Oracle-specific issue rather than a broader AI-trade problem. This adds to a credit-focused narrative that could weigh on sentiment if it develops further.
That theme lines up with an Investing.com piece published during Tuesday’s session. It raised questions around Oracle’s negative free cash flow and what it means for the company’s AI ambitions. If those cash-flow and leverage concerns intensify, the daily downtrend has every reason to reassert itself.
News Flow: AI Contracts, Cash Flow, and Bond Yields
The news backdrop around Oracle stock is genuinely split between bullish AI contract momentum and bearish cash-flow and bond-yield concerns.
The AI cloud contract backlog and record RPO figure are the clearest bullish argument. They were already circulating before Tuesday’s close. At the same time, the negative free cash flow debate and the bond yield story are the clearest bearish counterweight. The yield piece and a separate Yahoo Finance report on Oracle’s after-hours product news both arrived after Tuesday’s close. That report covered the launch of Oracle Fusion Claw AI applications and new compliance tools for financial institutions. It also cited a 4.2% afternoon move.
Those items did not shape Tuesday’s session, but they are worth watching into the next one. They speak directly to the tension between Oracle’s AI growth story and the cash burn required to fund it.
Putting it together, Tuesday’s rally in Oracle stock looks more like a volatility event inside a bearish daily trend than a confirmed turn. The hourly chart shows genuine stabilization. The 15-minute chart shows the bounce cooling off. However, the daily EMAs, RSI, and MACD are all still aligned against the bulls. With ATR readings elevated across both the daily and hourly timeframes, wide swings are likely to continue in either direction. The signals are conflicting. The bond-yield and cash-flow debate weighs on one side. The AI contract growth story supports the other. This looks like a market still searching for direction rather than one ready to commit.
FAQ
What is the current price of Oracle stock and how did it perform on September 29, 2026?
Oracle stock closed at $137.79 on Tuesday, September 29, 2026, gaining 3.91% from the previous close of $132.60 on September 28. It was one of the sharpest single-session moves in recent weeks.
Is Oracle stock in a bullish or bearish trend?
The daily chart remains firmly bearish. Oracle stock is trading below the 20-day EMA at $144.35, the 50-day EMA at $147.15, and the 200-day EMA at $175.62 in stacked bearish alignment. Daily RSI14 at 43.07 and a widening MACD histogram confirm that bearish momentum is still intact.
What are the key support and resistance levels for Oracle stock?
The daily pivot point sits at $138, with resistance at $143.46 (R1) and support at $132.33 (S1). The lower Bollinger Band at $131.29 provides additional support context. On the upside, reclaiming the 20-day EMA at $144.35 would be a meaningful bullish signal.
What fundamental factors are affecting Oracle stock right now?
The news backdrop is split. Bullish factors include Oracle’s $664 billion in remaining performance obligations, fueled by more than $30 billion in new AI cloud contracts. Bearish factors include negative free cash flow concerns flagged during Tuesday’s session and Oracle’s bond yields running near 8%, as flagged in an after-hours report.
Disclaimer: This article is for informational purposes only and does not constitute financial advice, an investment recommendation, or a solicitation to buy or sell any financial instrument or cryptocurrency. The analysis provided is not indicative of future results. Investing in crypto assets and financial markets carries a high risk of capital loss. Always do your own research (DYOR) and consult a qualified financial advisor before making any decision.
Article produced with the assistance of artificial intelligence and reviewed by the editorial team.