🌐 Sei Network ($SEI ): Technical Recovery in the Bottom Zone and Post-Pump Risk Management +65% 📊
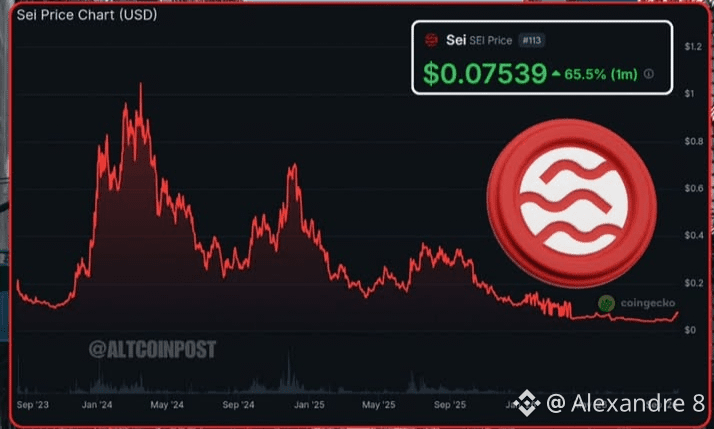
The $SEI token, a native Layer-1 asset optimized for high-speed trading, is trading in the range of $0.07539, up a positive +65.5% over the last month. After a long downtrend from its all-time high above $1.00, the asset is testing a double-bottom structure and recovery on the daily chart.
For the Binance Square audience, the current scenario calls for a clear analysis of the project’s infrastructure value versus the entry/exit points on the chart:
🏛️ 1. Fundamental Analysis (Long-Term Thesis)
Sei Network stands out as a blockchain focused on delivering maximum liquidity and speed for decentralized exchanges (DEXs) and trading applications:
Parallelized Infrastructure: The protocol provides high-performance parallelized EVM execution, aiming to solve latency bottlenecks in the DeFi sector.
Long-Term View (Hodler): For the investor focused on the thesis, reversals coming out of deep bottom consolidations provide accumulation windows through phased buying (DCA), avoiding panic buys driven by short-term hype.
⚡ 2. Technical Analysis & Risk Management (Short-Term Operations)
For those looking for Swing Trade opportunities or tactical entry:
🟢 Entry Point and Support: The $0.065 to $0.070 region acts as recent support and a consolidation zone. Buy entries should target retests with volume confirmation in this range.
🛑 Risk Management (Stop Loss): Using a Stop Loss is essential to contain sudden volatility. Place the technical stop just below the low of the recovery move on the time chart you’re using (e.g., 4H or Daily).
🎯 Exit Points (Take Profit): Set targets for partial profit-taking as the price approaches the intermediate resistance levels at $0.10 and $0.15.
🔒 Safe Execution in the Binance App
👇 Access the official trading pair(s) below: $SEI
#Write2Earn!
The $SEI token, a native Layer-1 asset optimized for high-speed trading, is trading in the range of $0.07539, up a positive +65.5% over the last month. After a long downtrend from its all-time high above $1.00, the asset is testing a double-bottom structure and recovery on the daily chart.
For the Binance Square audience, the current scenario calls for a clear analysis of the project’s infrastructure value versus the entry/exit points on the chart:
🏛️ 1. Fundamental Analysis (Long-Term Thesis)
Sei Network stands out as a blockchain focused on delivering maximum liquidity and speed for decentralized exchanges (DEXs) and trading applications:
Parallelized Infrastructure: The protocol provides high-performance parallelized EVM execution, aiming to solve latency bottlenecks in the DeFi sector.
Long-Term View (Hodler): For the investor focused on the thesis, reversals coming out of deep bottom consolidations provide accumulation windows through phased buying (DCA), avoiding panic buys driven by short-term hype.
⚡ 2. Technical Analysis & Risk Management (Short-Term Operations)
For those looking for Swing Trade opportunities or tactical entry:
🟢 Entry Point and Support: The $0.065 to $0.070 region acts as recent support and a consolidation zone. Buy entries should target retests with volume confirmation in this range.
🛑 Risk Management (Stop Loss): Using a Stop Loss is essential to contain sudden volatility. Place the technical stop just below the low of the recovery move on the time chart you’re using (e.g., 4H or Daily).
🎯 Exit Points (Take Profit): Set targets for partial profit-taking as the price approaches the intermediate resistance levels at $0.10 and $0.15.
🔒 Safe Execution in the Binance App
👇 Access the official trading pair(s) below: $SEI
#Write2Earn!