

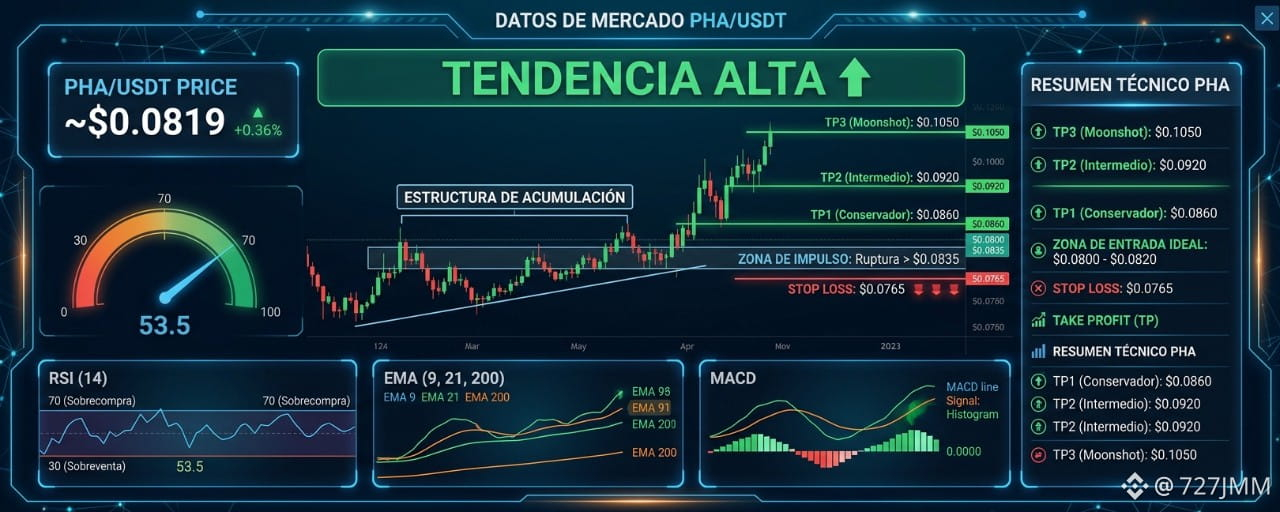


The PHA/USDT pair trades around $0.0819, showing strong price compression over a key support zone. The current technical reading reflects a transition from a consolidation phase to the development of a bullish impulse in the short to medium term.
Trading Operational Levels
Ideal Entry Zone: $0.0800 – $0.0820 (Accumulation Range)
Impulse Zone: Sustained breakout with volume above $0.0835
Stop Loss: $0.0765 (Invalidation level of the bullish structure)
TP1 (Conservative): $0.0860 (Initial target to take liquidity and secure profits)
TP2 (Intermediate): $0.0920 (Technical target based on the following daily resistance)
TP3 (Moonshot): $0.1050 (Extended target if the trend's strength remains)
Key Indicators Technical Analysis
RSI (14): It is at 53.5 points, trading stably above the neutral midline (50). This confirms a moderate bullish dominance without entering the overbought zone (>70), leaving room for further acceleration.
Moving Averages (EMA 9, 21, 200 / MA 50, 100): Price remains above the EMA 9 ($0.0812) and EMA 21 ($0.0805), establishing immediate dynamic support. MA 50 ($0.0835) acts as the first key resistance; surpassing it will pave the way toward the EMA 200 ($0.0950).
MACD: Shows a bullish crossover with the MACD line above the signal line. The histogram has moved into positive territory, confirming an increase in volume and buying momentum.
Trade subject to market volatility. Apply responsible risk management with an R/B ratio greater than 1:2.