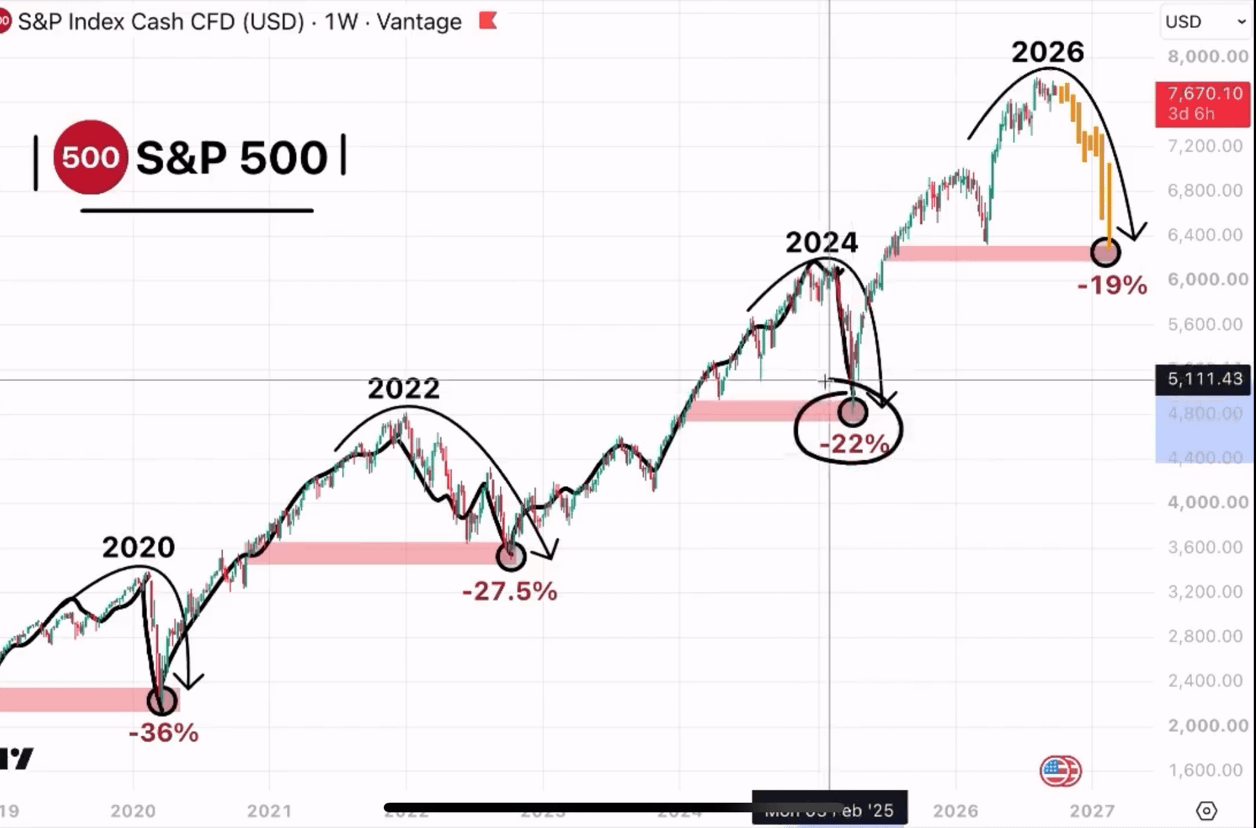
For this S&P 500 weekly chart, I suggest you save it first.
In the past few rounds of big drawdowns, it somehow followed a surprisingly interesting rhythm:
2020: -36%
2022: -27.5%
2024: -22%
2026: ?
Each time the trigger is different—pandemic, interest rate hikes, tariffs, liquidity…
But the price action looks similar:
New highs → weekly weakness → rapid selloff → a pullback to the prior key breakout zone.
If this rhythm keeps matching, what the market is really worth watching won’t necessarily be a minor drop of 5% or 10%, but rather the previous key area: 6150–6300.
Measured from the recent highs, that implies about a 19% pullback range.
Of course, history won’t mechanically repeat itself. 6150–6300 is only an observation zone inferred from this historical pattern—not a prediction that it will definitely be reached.
What truly makes me wary is this: the index is becoming increasingly dependent on a small number of large tech stocks. If they all weaken at the same time, the speed of the drawdown could be faster than many people expect.
2020: -36%
2022: -27.5%
2024: -22%
2026: Will it be time for -19%? 👀
Save this chart first.
In the past few rounds of big drawdowns, it somehow followed a surprisingly interesting rhythm:
2020: -36%
2022: -27.5%
2024: -22%
2026: ?
Each time the trigger is different—pandemic, interest rate hikes, tariffs, liquidity…
But the price action looks similar:
New highs → weekly weakness → rapid selloff → a pullback to the prior key breakout zone.
If this rhythm keeps matching, what the market is really worth watching won’t necessarily be a minor drop of 5% or 10%, but rather the previous key area: 6150–6300.
Measured from the recent highs, that implies about a 19% pullback range.
Of course, history won’t mechanically repeat itself. 6150–6300 is only an observation zone inferred from this historical pattern—not a prediction that it will definitely be reached.
What truly makes me wary is this: the index is becoming increasingly dependent on a small number of large tech stocks. If they all weaken at the same time, the speed of the drawdown could be faster than many people expect.
2020: -36%
2022: -27.5%
2024: -22%
2026: Will it be time for -19%? 👀
Save this chart first.