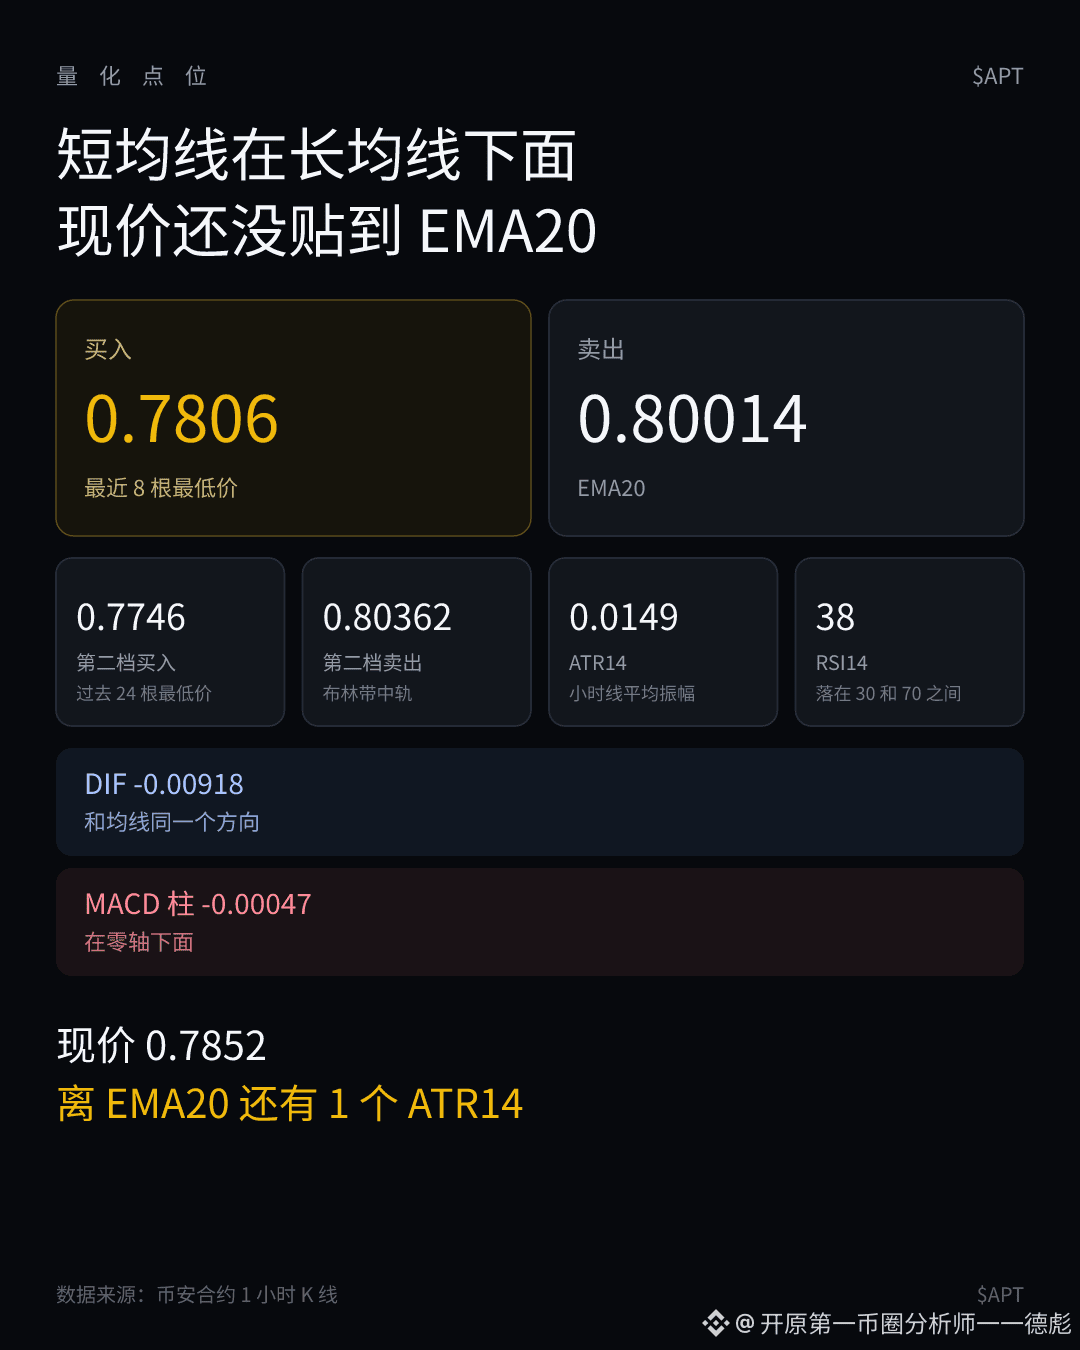
$APT current price 0.7852, on the hourly chart first look for the nearer buy entries.
- Sell 0.80014
- Sell 0.80362
- Buy 0.7806
- Buy 0.7746
Moving averages. The short moving average is below the long moving average; the current price is still 1 ATR14 away from the EMA20 and has not touched it yet.
The nearer buy is the lowest price among the most recent 8 hourly candles; the next buy level is the lowest price among the past 24 hourly candles.
The nearer sell is the EMA20; the farther sell is the Bollinger Band midline.
Momentum. Same direction as the moving averages. The MACD DIF -0.00918 is below the zero line. The histogram is -0.00047 and also below the zero line; it hasn’t turned stronger yet.
Volatility. The average swing amplitude of this hourly segment is ATR14 0.0149.
#APT
- Sell 0.80014
- Sell 0.80362
- Buy 0.7806
- Buy 0.7746
Moving averages. The short moving average is below the long moving average; the current price is still 1 ATR14 away from the EMA20 and has not touched it yet.
The nearer buy is the lowest price among the most recent 8 hourly candles; the next buy level is the lowest price among the past 24 hourly candles.
The nearer sell is the EMA20; the farther sell is the Bollinger Band midline.
Momentum. Same direction as the moving averages. The MACD DIF -0.00918 is below the zero line. The histogram is -0.00047 and also below the zero line; it hasn’t turned stronger yet.
Volatility. The average swing amplitude of this hourly segment is ATR14 0.0149.
#APT