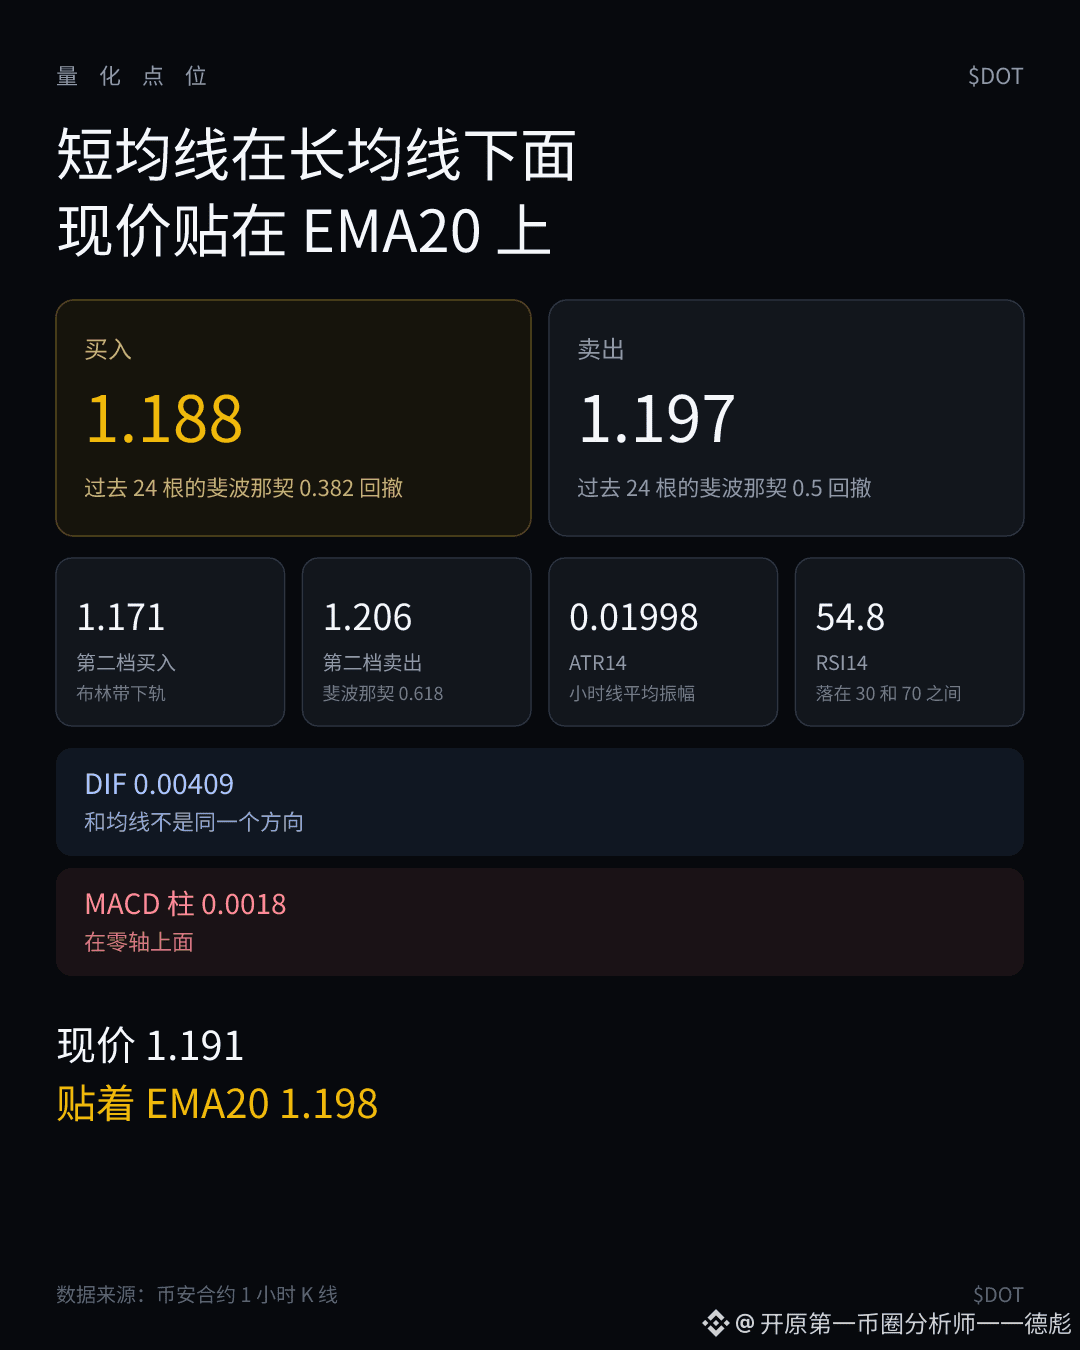
$DOT current price 1.191.
- Sell 1.197
- Sell 1.206
- Buy 1.188
- Buy 1.171
Moving averages. The short moving average is below the long moving average; the current price is close to the EMA20, only 0.34 ATR14 away.
The nearest buy is the Fibonacci 0.382 retracement over the past 24 hourly candles; the next buy level is the lower band of the Bollinger Bands.
The nearest sell is the Fibonacci 0.5 retracement over the past 24 hourly candles; the farther sell is the Fibonacci 0.618 retracement over the past 24 hourly candles.
The long moving average, EMA60, is at 1.208, and it is still above the two sell levels.
Momentum. MACD’s DIF 0.00409 is above the zero line. The histogram bars are 0.0018 and are above the zero line.
Volatility. The average swing of these hourly candles is ATR14 0.01998.
#DOT
- Sell 1.197
- Sell 1.206
- Buy 1.188
- Buy 1.171
Moving averages. The short moving average is below the long moving average; the current price is close to the EMA20, only 0.34 ATR14 away.
The nearest buy is the Fibonacci 0.382 retracement over the past 24 hourly candles; the next buy level is the lower band of the Bollinger Bands.
The nearest sell is the Fibonacci 0.5 retracement over the past 24 hourly candles; the farther sell is the Fibonacci 0.618 retracement over the past 24 hourly candles.
The long moving average, EMA60, is at 1.208, and it is still above the two sell levels.
Momentum. MACD’s DIF 0.00409 is above the zero line. The histogram bars are 0.0018 and are above the zero line.
Volatility. The average swing of these hourly candles is ATR14 0.01998.
#DOT