

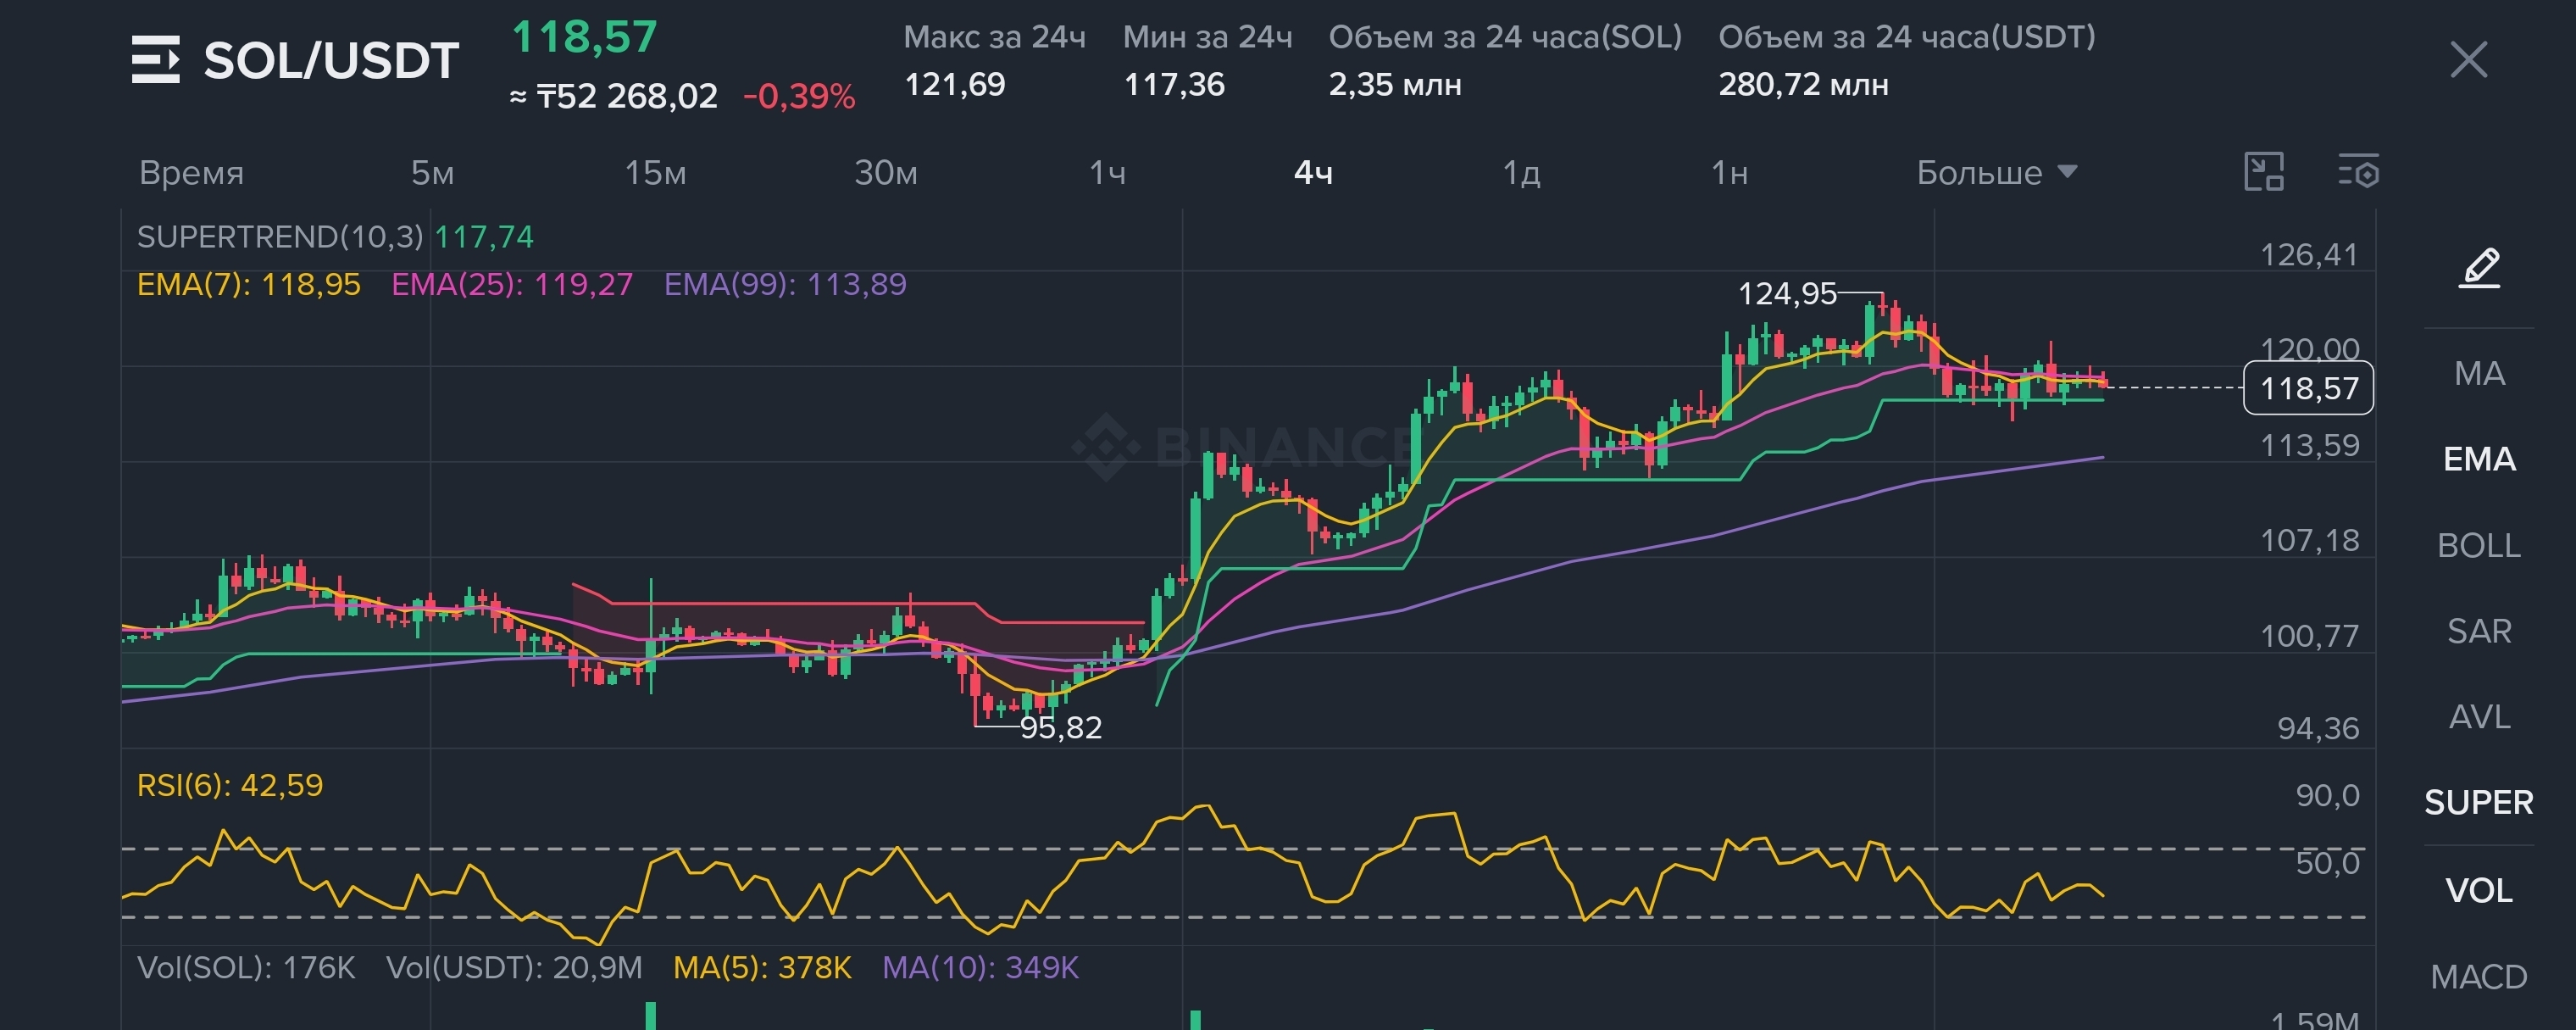

SOL/USDT — 4H analysis
$SOL it’s currently around 118.57$. After a strong rise from the 96$ zone, the price bumped into resistance at 124–125$ and moved into consolidation. Historically, over the past few days, the 124–125$ zone has indeed acted as the upper bound of the move.
📊 What the chart shows:
EMA99 — 113.89$ → the medium-term trend still remains bullish.
EMA7/25 — 118.95 / 119.27$ → price is slightly below both; in the short term there’s some weakness.
RSI(6) — 42.6 → sellers are a bit stronger, but there’s no oversold condition.
Supertrend — 117.74$ → the key nearest support level.
Volumes are declining → for now, there’s no confident momentum.
Levels: 🟢 Support: 117.7 → 115 → 113.9$
🔴 Resistance: 120 → 122 → 124.5–125$
Scenario:
If $SOL holds 117.7–118$ and returns above 120$, it could start testing 122–125$ again. A breakout of 125$ on good volume will change the picture in favor of continuing the uptrend.
If 117.7$ doesn’t hold, then a pullback is likely first to 115$, and below that — to 113.9$.
Right now I would call the picture neutral-to-sideways while keeping the medium-term bullish trend: the price is simply choosing direction after a strong move. At the same time, the fresh market $SOL is getting support from ongoing inflows into spot ETFs. #ChainlinkLaunchesBankSWIFTLedgerFramework