Behind the scenes of NEAR's liquidity $QNT and $NEAR —real momentum or whale traps? Regardless of the strength of the near coin in the long term, its support, the magnitude of liquidity, and far from emotion, here’s a smart numerical reading of the liquidity behind the scenes:
🎯 1️⃣ NEAR (hot market & high risk):
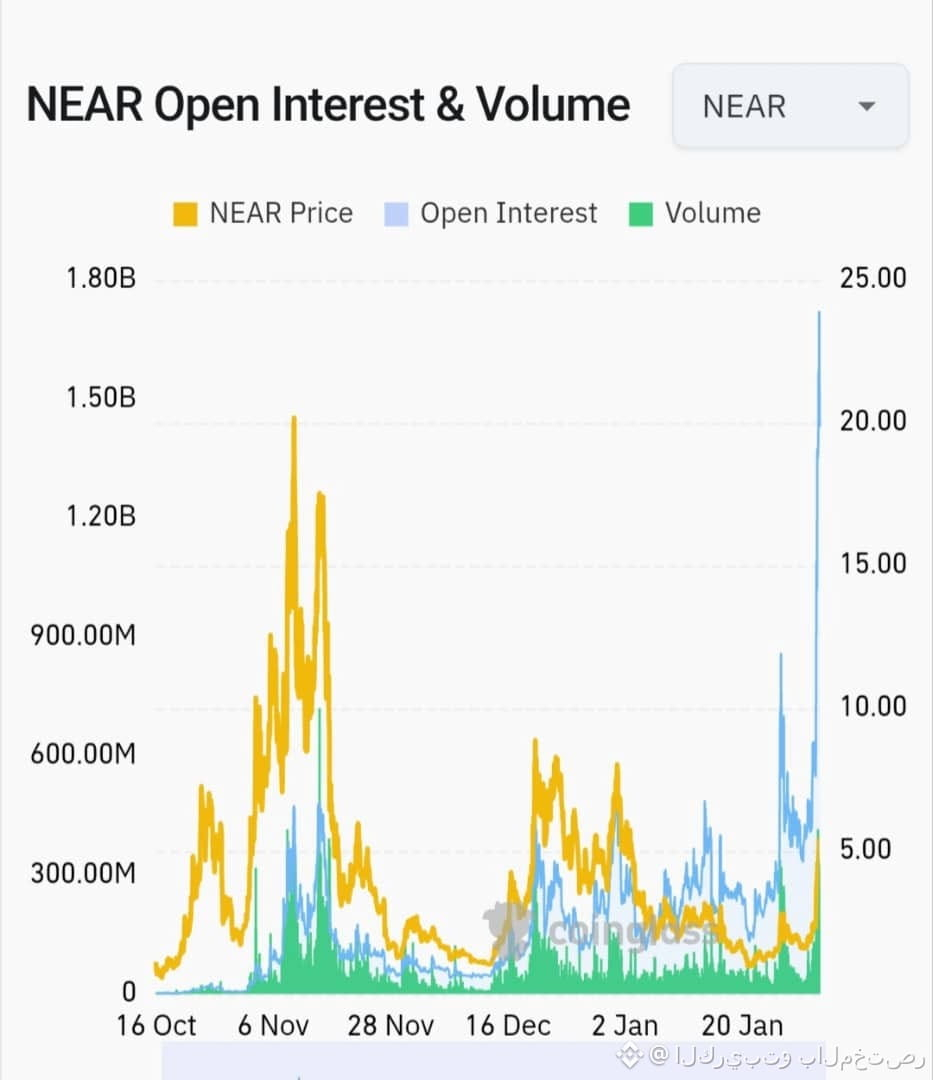
As shown in the first chart, the coin is witnessing a remarkable surge in Open Interest as the upward move is driven by excessive leverage and a process of “shorts’ squeeze” that chasing it now carries danger.
Buying (DCA): On the correction between 4.50 - 4.30, with higher safety around 4.00$.
Selling (take profits): Partially at 5.50 - 5.80$, while raising the stop to lock in profits.
🎯 2️⃣ QNT (a liquidity trick and flash traps):
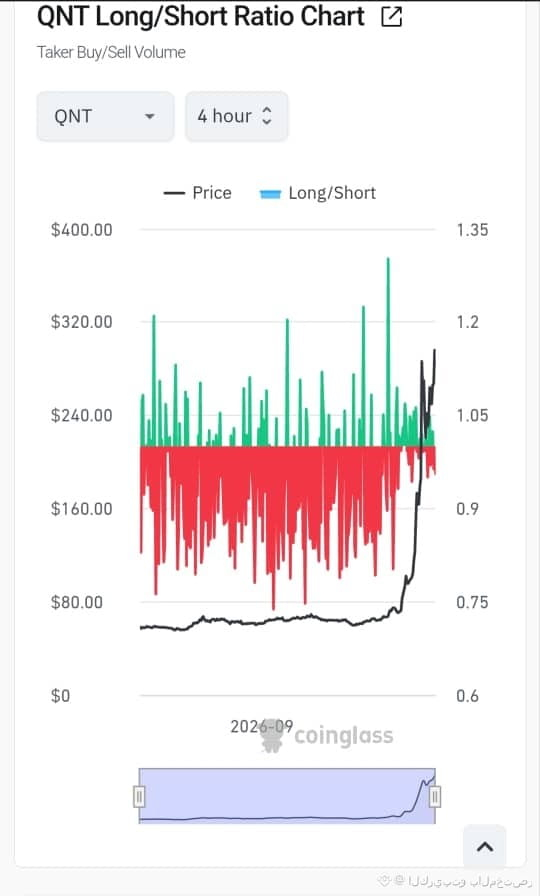
The second chart reveals the trick; the price surges violently to “squeeze” sell orders, while real liquidity remains stagnant at the bottom. The rise is a “temporary trap” set by whales to hit stops.
Buying (DCA): Quiet accumulation in the current bottom range between 48 - 46.
Selling (take profits): Immediately, by 50%, when any sudden explosive green candle appears before price drops again.
This is not financial advice.. your trading is your responsibility
🎯 1️⃣ NEAR (hot market & high risk):
As shown in the first chart, the coin is witnessing a remarkable surge in Open Interest as the upward move is driven by excessive leverage and a process of “shorts’ squeeze” that chasing it now carries danger.
Buying (DCA): On the correction between 4.50 - 4.30, with higher safety around 4.00$.
Selling (take profits): Partially at 5.50 - 5.80$, while raising the stop to lock in profits.
🎯 2️⃣ QNT (a liquidity trick and flash traps):
The second chart reveals the trick; the price surges violently to “squeeze” sell orders, while real liquidity remains stagnant at the bottom. The rise is a “temporary trap” set by whales to hit stops.
Buying (DCA): Quiet accumulation in the current bottom range between 48 - 46.
Selling (take profits): Immediately, by 50%, when any sudden explosive green candle appears before price drops again.
This is not financial advice.. your trading is your responsibility