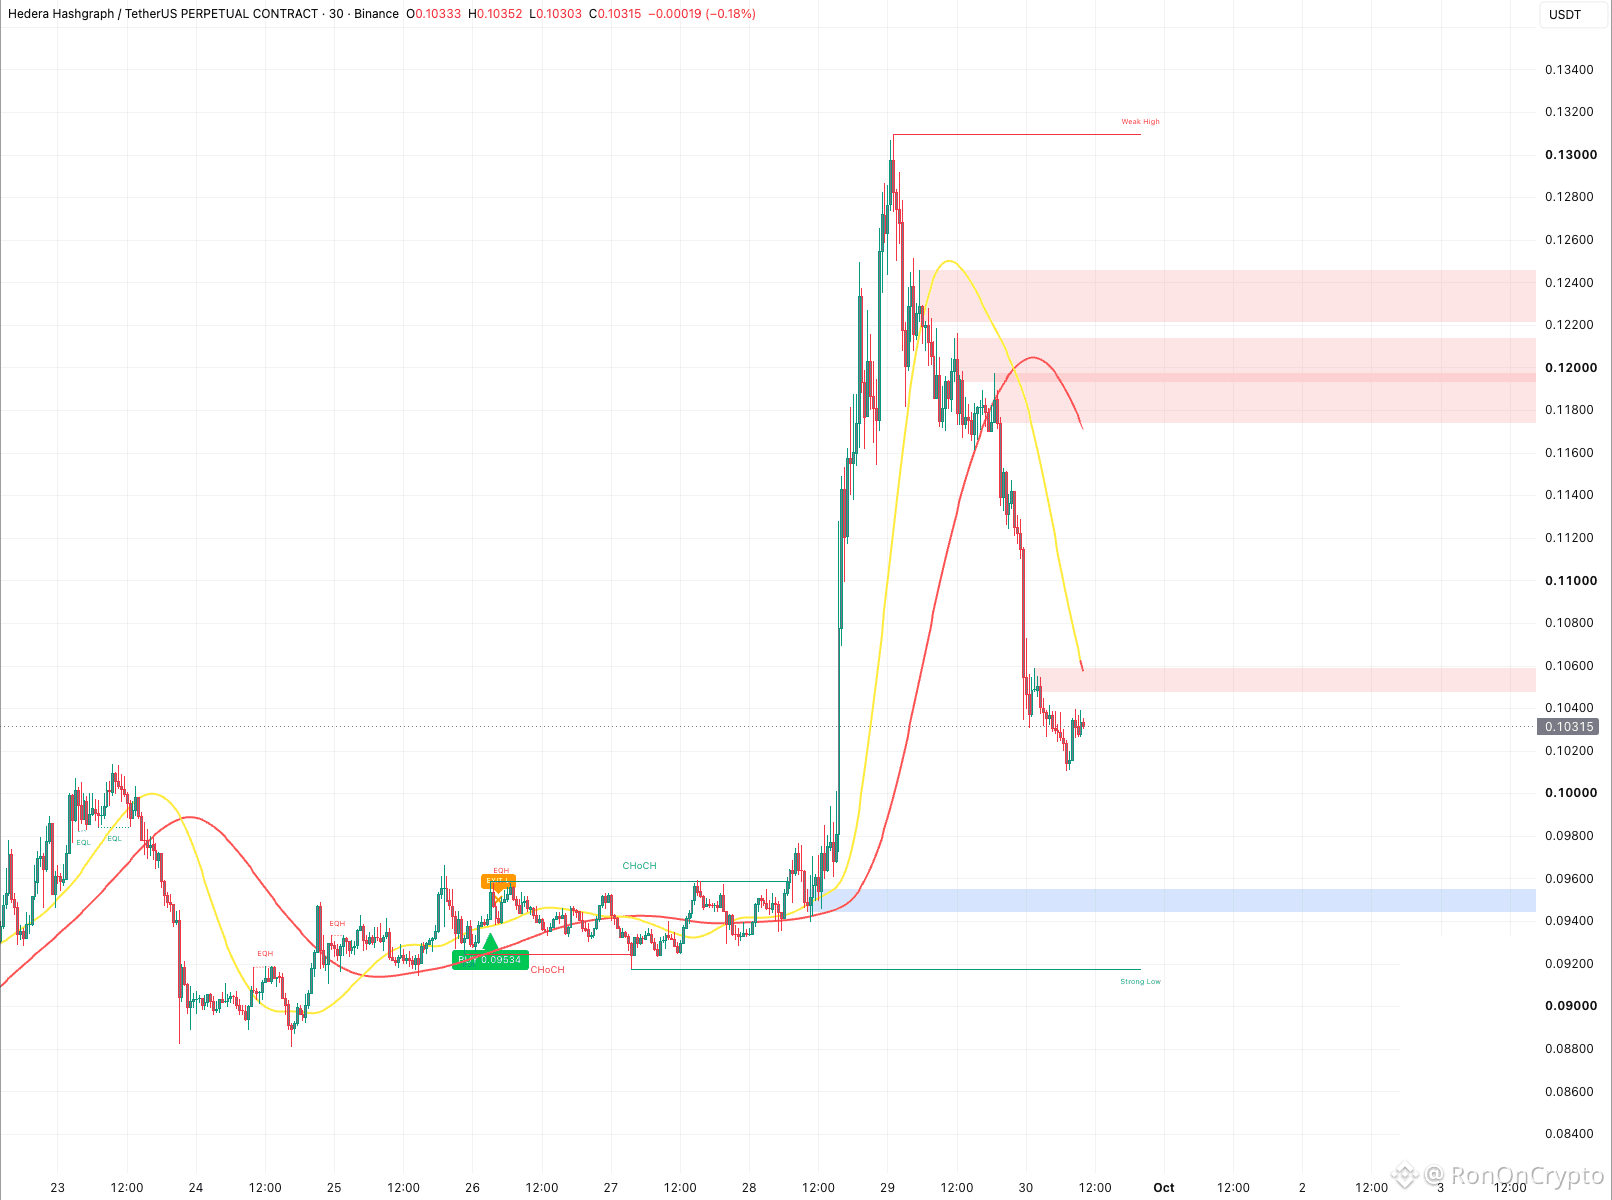
$HBAR 0,105 — analyze the 1H, 30m, 15m chart.
From 0,131 it dropped to 0,101, losing nearly 23% in just over a day, and is currently rebounding.
On the afternoon of 28/9, HBAR broke out from 0,097 to 0,131, then dumped back and erased the entire previous day. At 10:00, the 30m timeframe confirmed the downward force. Since then, the 15m timeframe has been gradually rebounding from 0,101 to 0,105.
On the daily chart, the indicator is still holding a long from 0,0865 and has not been broken.
Above: 0,105–0,106, a resistance zone right in front of you.
Below: 0,100, then the 0,094–0,096 zone, where price surged up on 28/9.
0,106 — will it break through or get pushed back down?
Personal observation only, not investment advice. Risk is 1%, always with a stop point.
#HBAR #Hedera $HBAR
From 0,131 it dropped to 0,101, losing nearly 23% in just over a day, and is currently rebounding.
On the afternoon of 28/9, HBAR broke out from 0,097 to 0,131, then dumped back and erased the entire previous day. At 10:00, the 30m timeframe confirmed the downward force. Since then, the 15m timeframe has been gradually rebounding from 0,101 to 0,105.
On the daily chart, the indicator is still holding a long from 0,0865 and has not been broken.
Above: 0,105–0,106, a resistance zone right in front of you.
Below: 0,100, then the 0,094–0,096 zone, where price surged up on 28/9.
0,106 — will it break through or get pushed back down?
Personal observation only, not investment advice. Risk is 1%, always with a stop point.
#HBAR #Hedera $HBAR