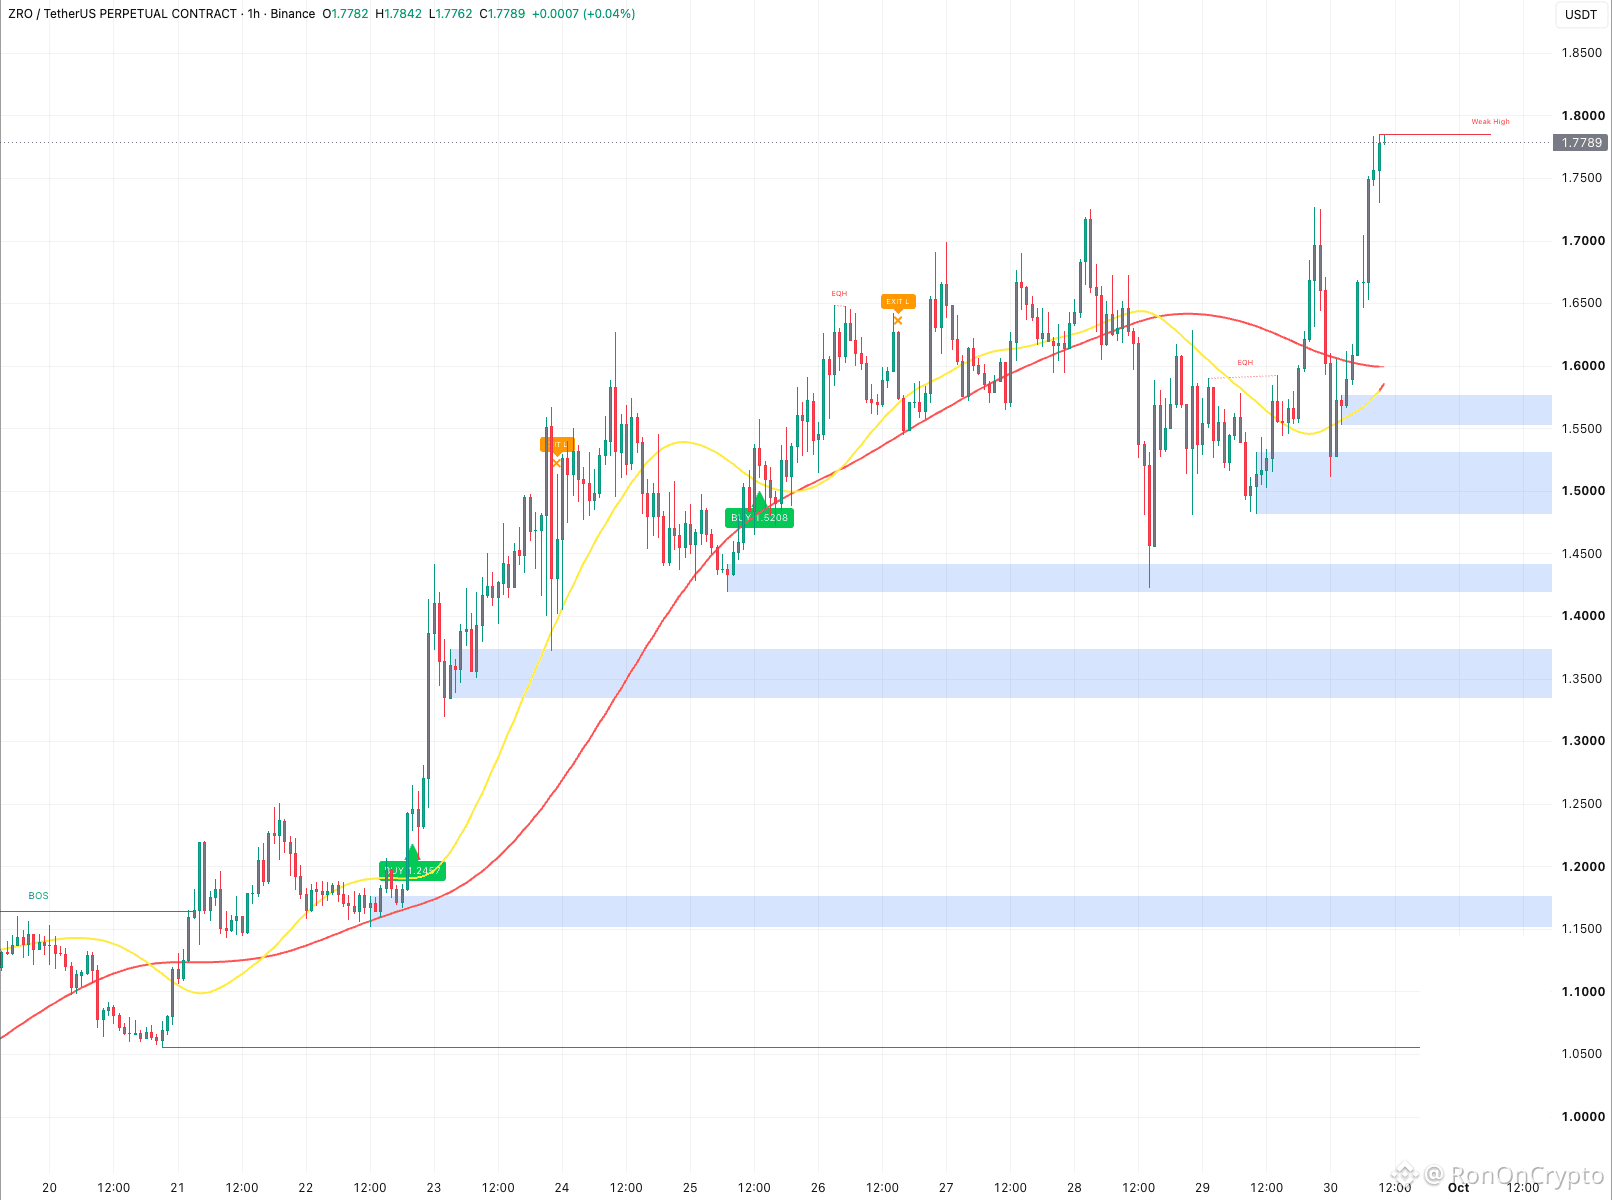
$ZRO 1,80 — analysis of the 1D, 1H, 30m, 15m timeframes.
All four timeframes are moving upward together.
Over the past three days, ZRO has been stuck in the 1.42–1.73 range. This morning it broke above, hit 1.80, and is up more than 18% in 24h.
The 15m timeframe has just confirmed the upward momentum; the indicator is now waiting for a pullback. The daily timeframe has already moved far away from the moving average.
Up next: 1.80, then the daily timeframe resistance zone at 1.89–2.06.
Downside: 1.70–1.73, with the previous peak recently broken. If this zone is lost, look at 1.65–1.67.
1.70 — if it pulls back, will it hold?
Personal observation only, not investment advice. 1% risk—there’s always a point where you stop.
#ZRO #LayerZero $ZRO
All four timeframes are moving upward together.
Over the past three days, ZRO has been stuck in the 1.42–1.73 range. This morning it broke above, hit 1.80, and is up more than 18% in 24h.
The 15m timeframe has just confirmed the upward momentum; the indicator is now waiting for a pullback. The daily timeframe has already moved far away from the moving average.
Up next: 1.80, then the daily timeframe resistance zone at 1.89–2.06.
Downside: 1.70–1.73, with the previous peak recently broken. If this zone is lost, look at 1.65–1.67.
1.70 — if it pulls back, will it hold?
Personal observation only, not investment advice. 1% risk—there’s always a point where you stop.
#ZRO #LayerZero $ZRO