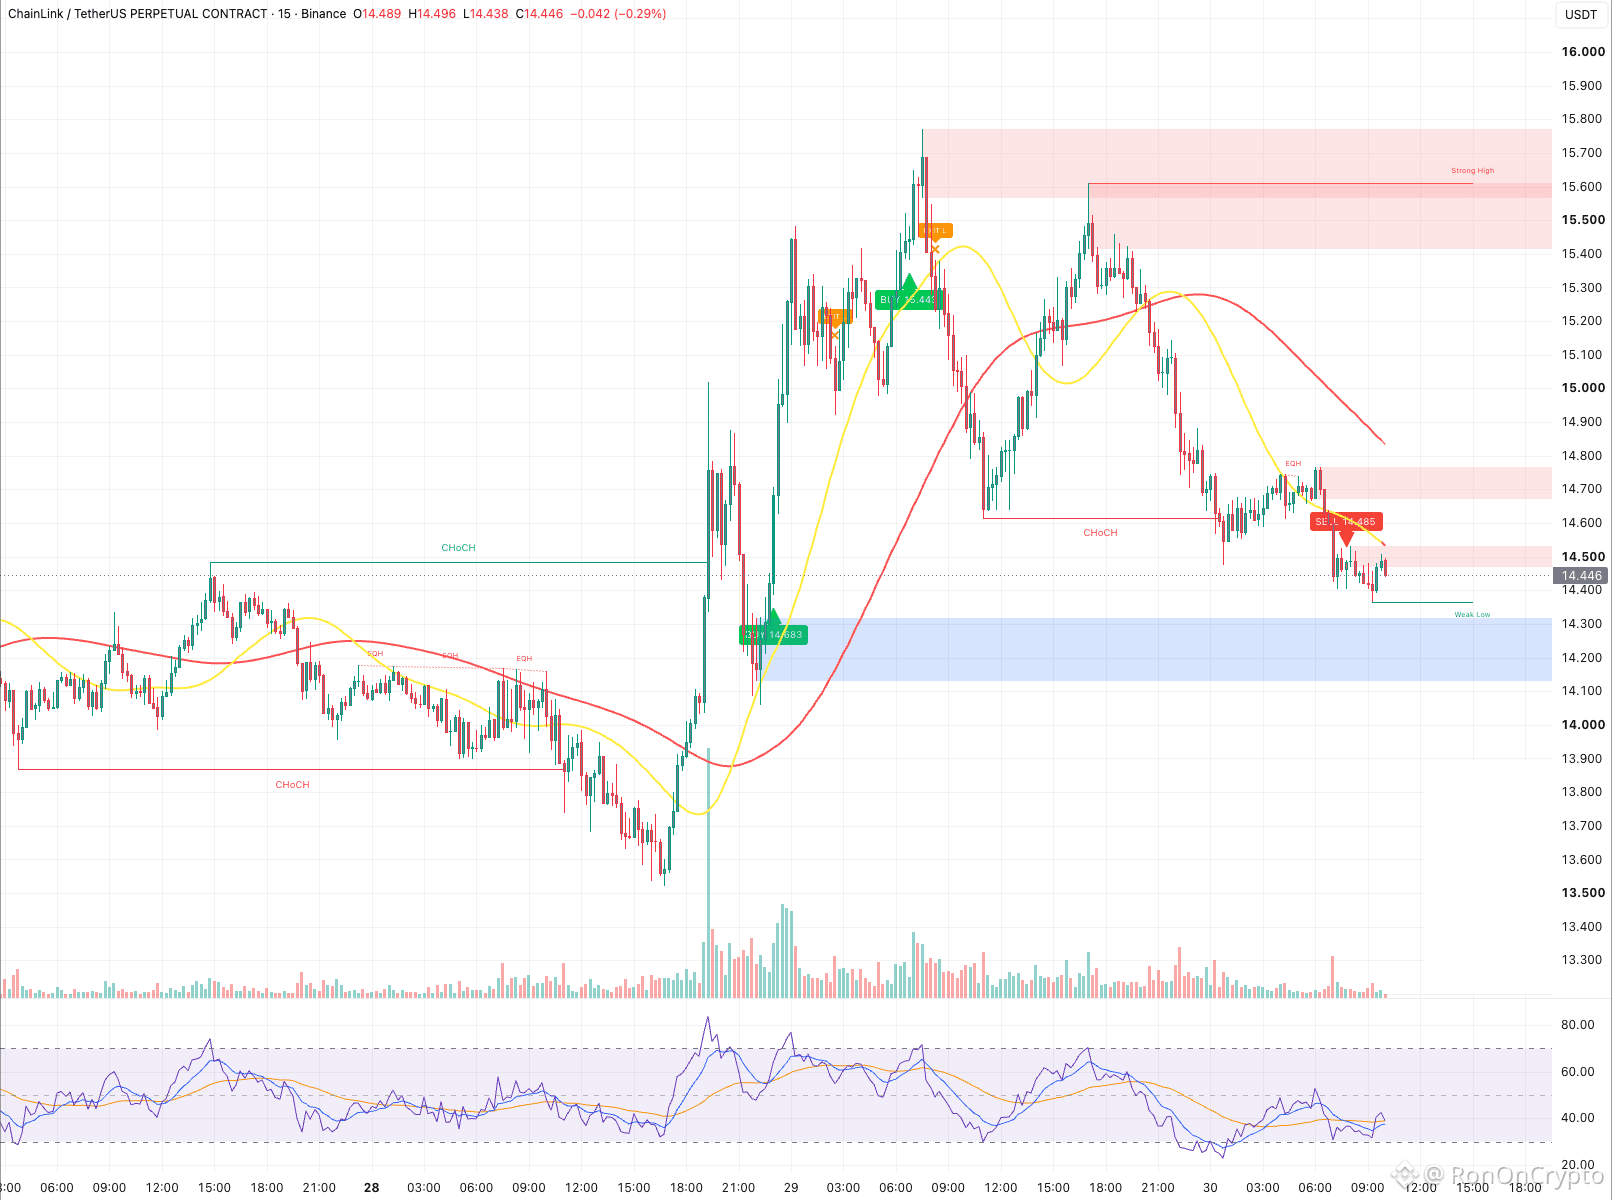
$LINK 14,4 — analyze the 1H, 30m, 15m chart.
Yesterday I asked whether 15.0 holds or breaks. It broke at 10am, dropping to 14.62.
Yesterday afternoon it bounced up to 15.61, but got pushed down in the 15.4–15.6 area, then slid the whole night to 14.36 this morning.
The 1H, 30m, and 15m timeframes are all adjusting; the moving average line on the smaller chart is turning downward. The 15m indicator is holding a short from 14.49. The daily timeframe is resting; the trend hasn’t broken yet.
Above: 14.5, then 14.7–14.8.
Below: 14.1–14.3, right in the zone I noted yesterday.
14.1–14.3 — will it hold or break?
Personal observation only, not investment advice. Risk is 1%; there is always a stop point.
#LINK #Chainlink $LINK
Yesterday I asked whether 15.0 holds or breaks. It broke at 10am, dropping to 14.62.
Yesterday afternoon it bounced up to 15.61, but got pushed down in the 15.4–15.6 area, then slid the whole night to 14.36 this morning.
The 1H, 30m, and 15m timeframes are all adjusting; the moving average line on the smaller chart is turning downward. The 15m indicator is holding a short from 14.49. The daily timeframe is resting; the trend hasn’t broken yet.
Above: 14.5, then 14.7–14.8.
Below: 14.1–14.3, right in the zone I noted yesterday.
14.1–14.3 — will it hold or break?
Personal observation only, not investment advice. Risk is 1%; there is always a stop point.
#LINK #Chainlink $LINK