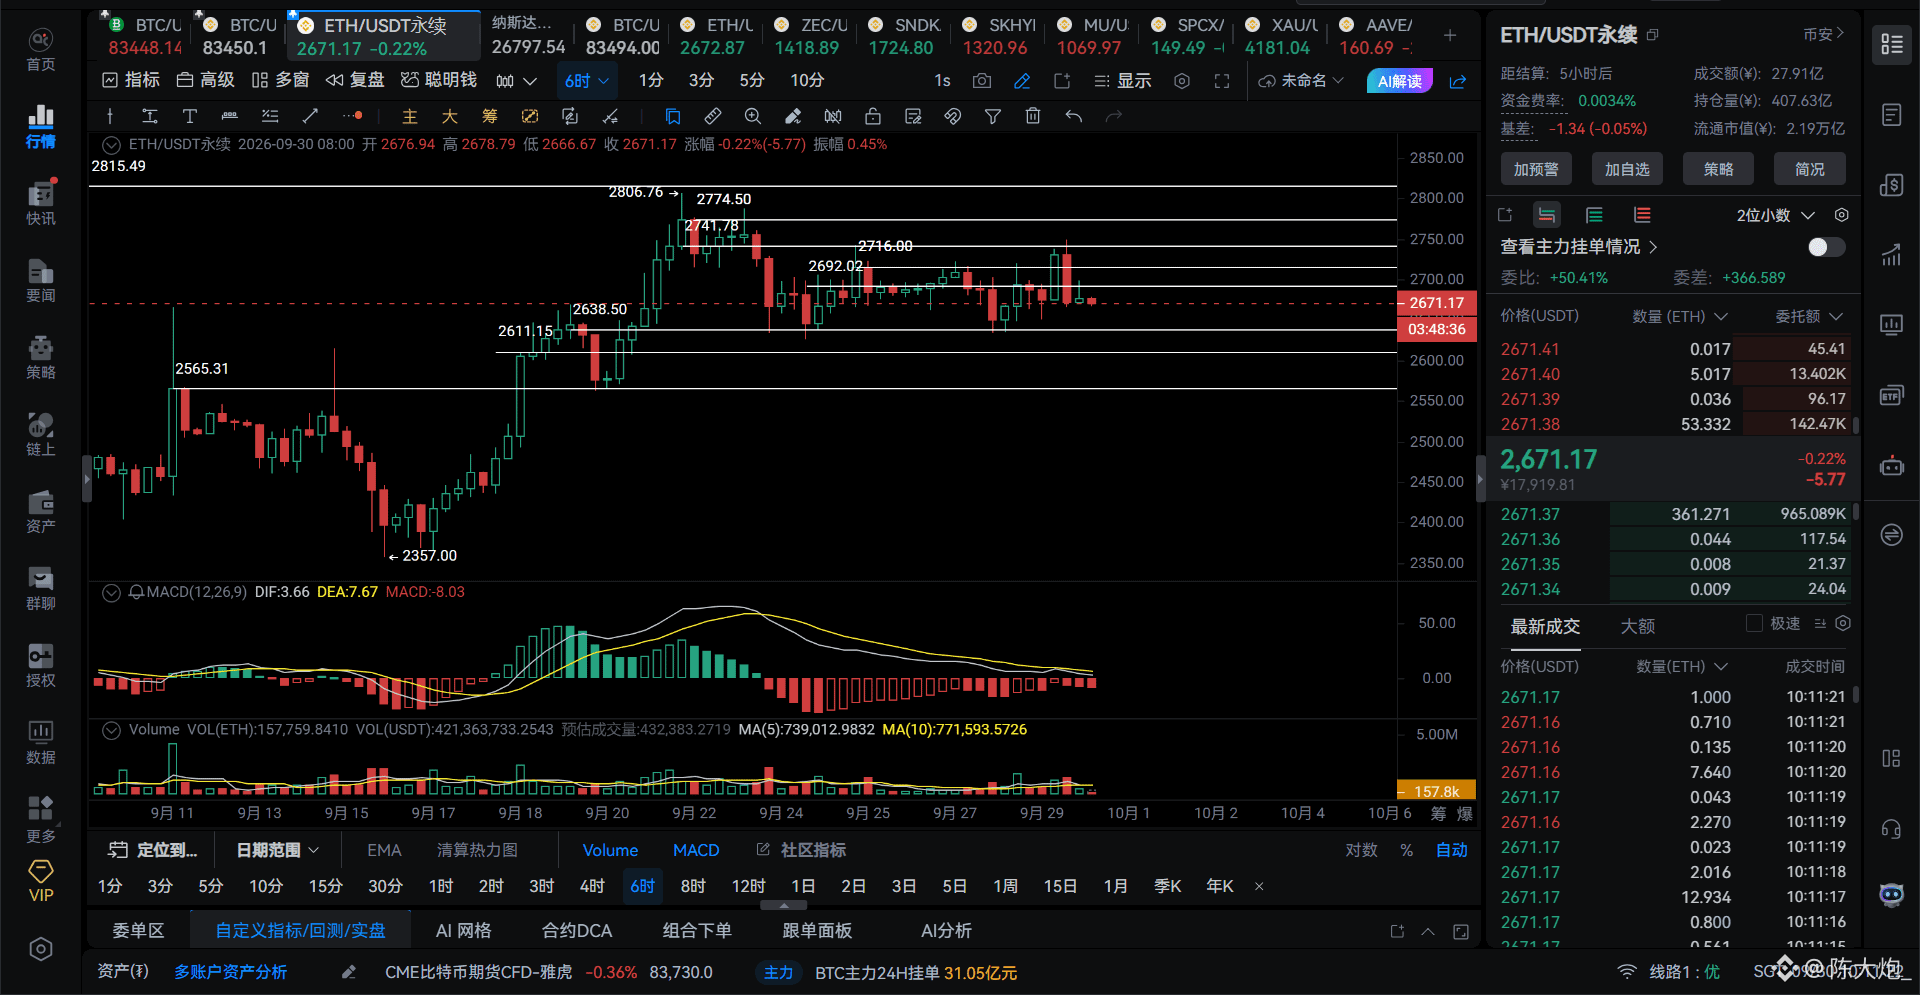

Ethereum follows the overall market lower, but there is limited room for further downside. As long as the structure level is not broken, it will remain in a ranging/sideways zone.
On the 2-day chart, the opening line closes with a dead cross; on the daily/12-hour level there is a divergence at the high for short entries; an 8-hour session shows an “invisible” decline.
The internal mid-timeframe level still needs to adjust gradually.
Watch for a drop on the 30-minute chart, then the 15-minute chart will slowly grind the lows.
Ethereum’s key structure level below is at 2611. Only a close with the body below it will trigger a market turn.
Strong support is in the 2576–2550 range; you can attempt short-term long positions there.
Overhead resistance: 2692, 2716, 2742, 2774.
Downside support: 2638, 2611, 2578, 2552.
$ETH
On the 2-day chart, the opening line closes with a dead cross; on the daily/12-hour level there is a divergence at the high for short entries; an 8-hour session shows an “invisible” decline.
The internal mid-timeframe level still needs to adjust gradually.
Watch for a drop on the 30-minute chart, then the 15-minute chart will slowly grind the lows.
Ethereum’s key structure level below is at 2611. Only a close with the body below it will trigger a market turn.
Strong support is in the 2576–2550 range; you can attempt short-term long positions there.
Overhead resistance: 2692, 2716, 2742, 2774.
Downside support: 2638, 2611, 2578, 2552.
$ETH