Top 20 Biggest Decliners: Interpretation
First tier (real-time data):
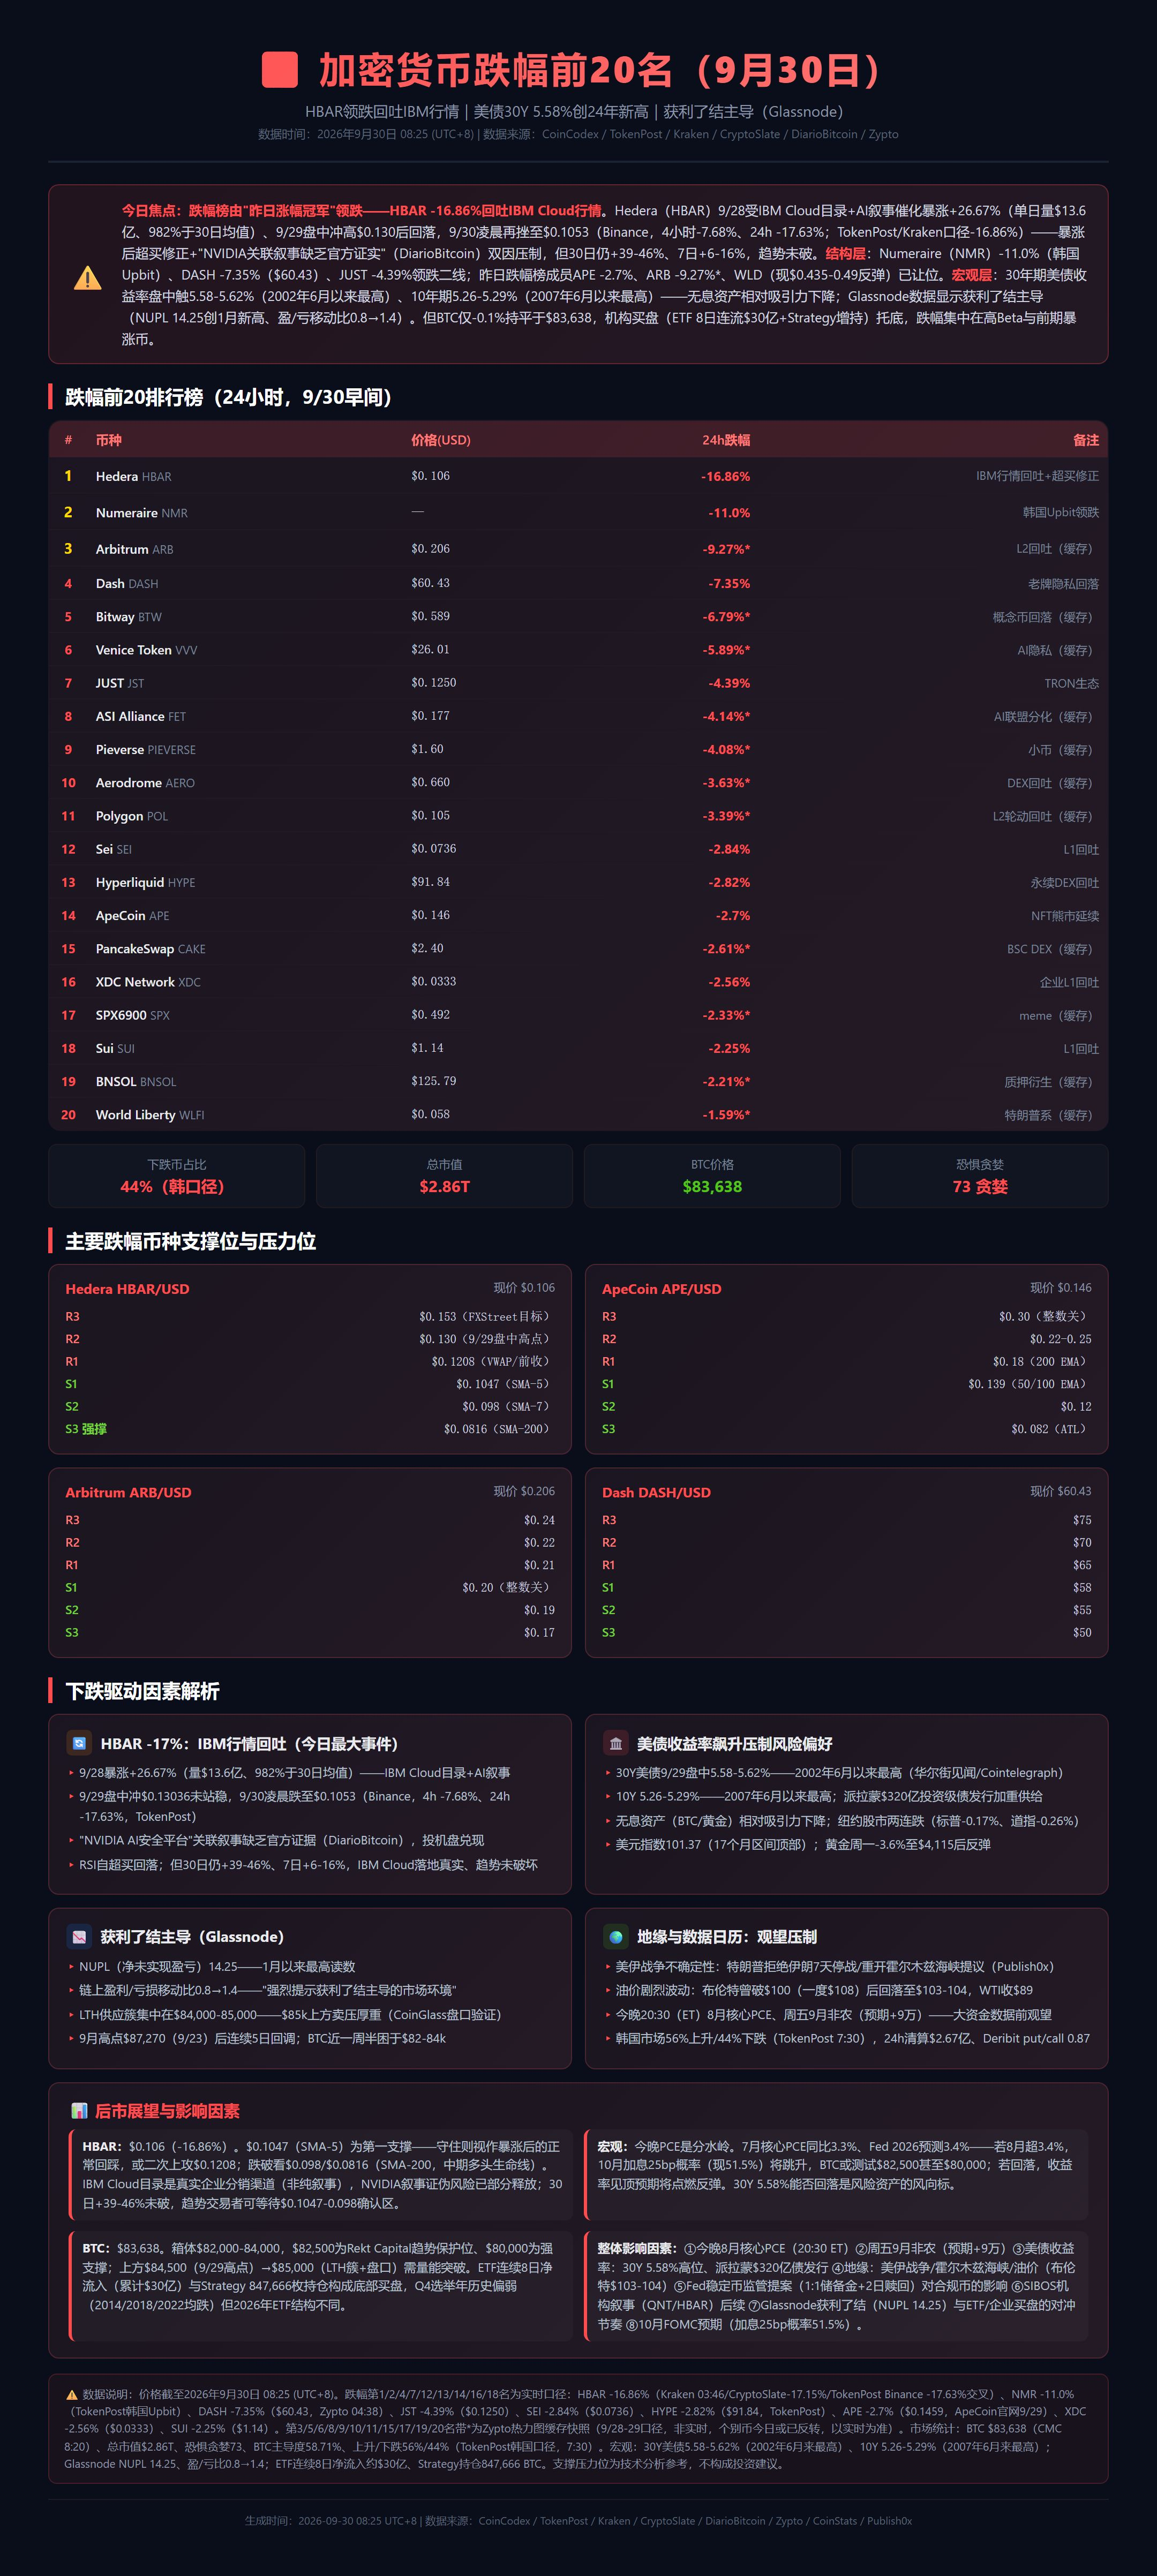
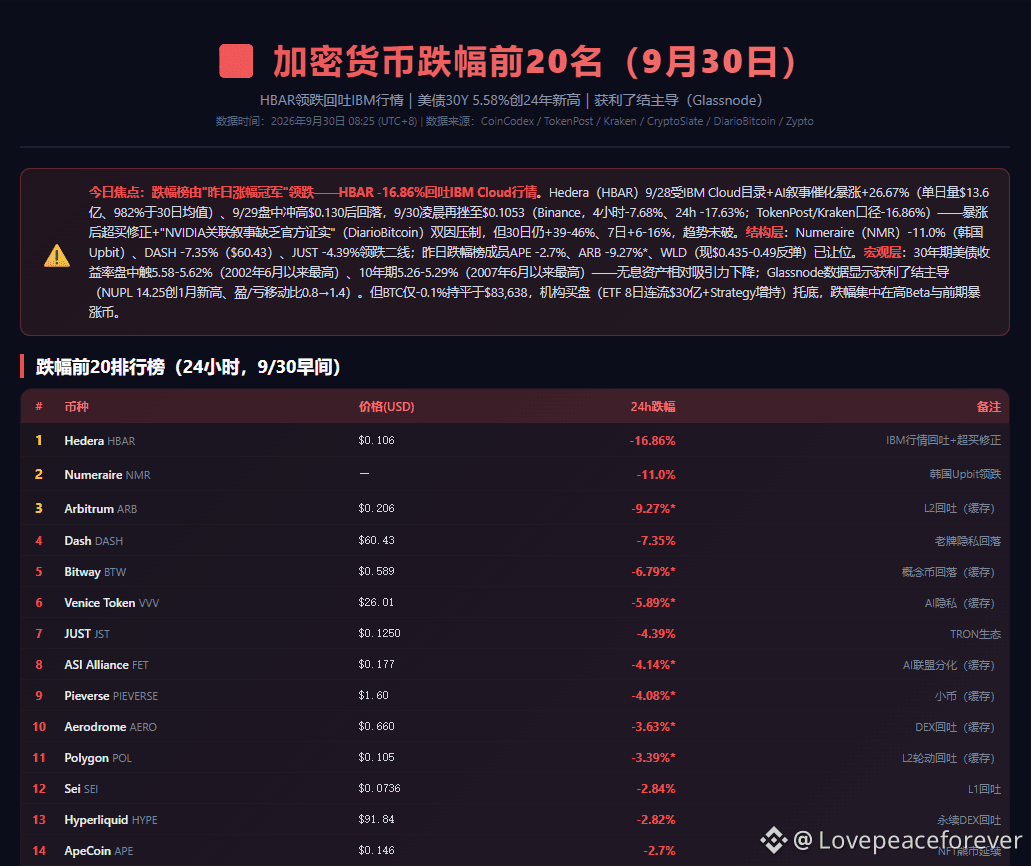
Hedera -16.86%—— IBM market data pullback + overbought correction, today’s main focus;
#numeraire -11.0%—— AI hedging-fund predictions for market concepts, South Korea’s Upbit leads the decline;
Arbitrum -9.27%*—— L2 pullback (cache-based figures);
$DASH -7.35%—— A drop in an established privacy coin;
Bitway -6.79%*、Venice Token #VVV —— concept coins and AI privacy tokens pull back (cached);
JUST -4.39%—— Tron ecosystem pullback (real-time).
Second tier (mix of real-time + cached): ASI Alliance -4.14%, Pieverse -4.08%*, #Aerodrome -3.63%, Polygon$POL -3.39%*
III. Breakdown of the Factors Driving the Decline
(A) $HBAR -17%: textbook-style profit taking after a surge
HBAR’s downside path is clear and traceable: On 9/28, in response to the IBM Cloud directory + an AI narrative catalyst, trading volume surged dramatically (transactions of $1.36 billion, up 982% versus the 30-day average), pushing the price to +26.67%; On 9/29, the price spiked higher but failed to hold the level (0.13036), and profit-taking began to cash out; In the early hours of 9/30, with hints that the “NVIDIA AI security platform” related narrative lacked official evidence, speculative positions rushed to exit, and the price saw a day-over-day pullback of -16.86% to the $0.105–0.11 range. This process is essentially the classic combination of “event-driven breakout + overbought technical correction”: RSI retreated from overbought territory, and short-term position turnover was intense (as of 9/30, trading still totaled about $657 million). The key to judging the trend is that: the IBM Cloud directory is a real, enterprise-level distribution channel (not just narrative), the debunking of the NVIDIA narrative only affects short-term speculative momentum and does not change the fundamentals; the structure of +39% to +46% over the 30-day period remains intact—so it is more likely a healthy deep pullback rather than the end of the trend.
(B) US Treasury yields spike: suppressing risk appetite
On 9/29, the 30Y US Treasury yield peaked in-session at 5.58–5.62%, the highest since June 2002, while the 10Y yield hit 5.26–5.29%, the highest since June 2007. The main driver was the market’s repricing of an October rate hike combined with the increased supply from the $32 billion investment-grade bond issuance by the Paramon group.
First tier (real-time data):
Hedera -16.86%—— IBM market data pullback + overbought correction, today’s main focus;
#numeraire -11.0%—— AI hedging-fund predictions for market concepts, South Korea’s Upbit leads the decline;
Arbitrum -9.27%*—— L2 pullback (cache-based figures);
$DASH -7.35%—— A drop in an established privacy coin;
Bitway -6.79%*、Venice Token #VVV —— concept coins and AI privacy tokens pull back (cached);
JUST -4.39%—— Tron ecosystem pullback (real-time).
Second tier (mix of real-time + cached): ASI Alliance -4.14%, Pieverse -4.08%*, #Aerodrome -3.63%, Polygon$POL -3.39%*
III. Breakdown of the Factors Driving the Decline
(A) $HBAR -17%: textbook-style profit taking after a surge
HBAR’s downside path is clear and traceable: On 9/28, in response to the IBM Cloud directory + an AI narrative catalyst, trading volume surged dramatically (transactions of $1.36 billion, up 982% versus the 30-day average), pushing the price to +26.67%; On 9/29, the price spiked higher but failed to hold the level (0.13036), and profit-taking began to cash out; In the early hours of 9/30, with hints that the “NVIDIA AI security platform” related narrative lacked official evidence, speculative positions rushed to exit, and the price saw a day-over-day pullback of -16.86% to the $0.105–0.11 range. This process is essentially the classic combination of “event-driven breakout + overbought technical correction”: RSI retreated from overbought territory, and short-term position turnover was intense (as of 9/30, trading still totaled about $657 million). The key to judging the trend is that: the IBM Cloud directory is a real, enterprise-level distribution channel (not just narrative), the debunking of the NVIDIA narrative only affects short-term speculative momentum and does not change the fundamentals; the structure of +39% to +46% over the 30-day period remains intact—so it is more likely a healthy deep pullback rather than the end of the trend.
(B) US Treasury yields spike: suppressing risk appetite
On 9/29, the 30Y US Treasury yield peaked in-session at 5.58–5.62%, the highest since June 2002, while the 10Y yield hit 5.26–5.29%, the highest since June 2007. The main driver was the market’s repricing of an October rate hike combined with the increased supply from the $32 billion investment-grade bond issuance by the Paramon group.