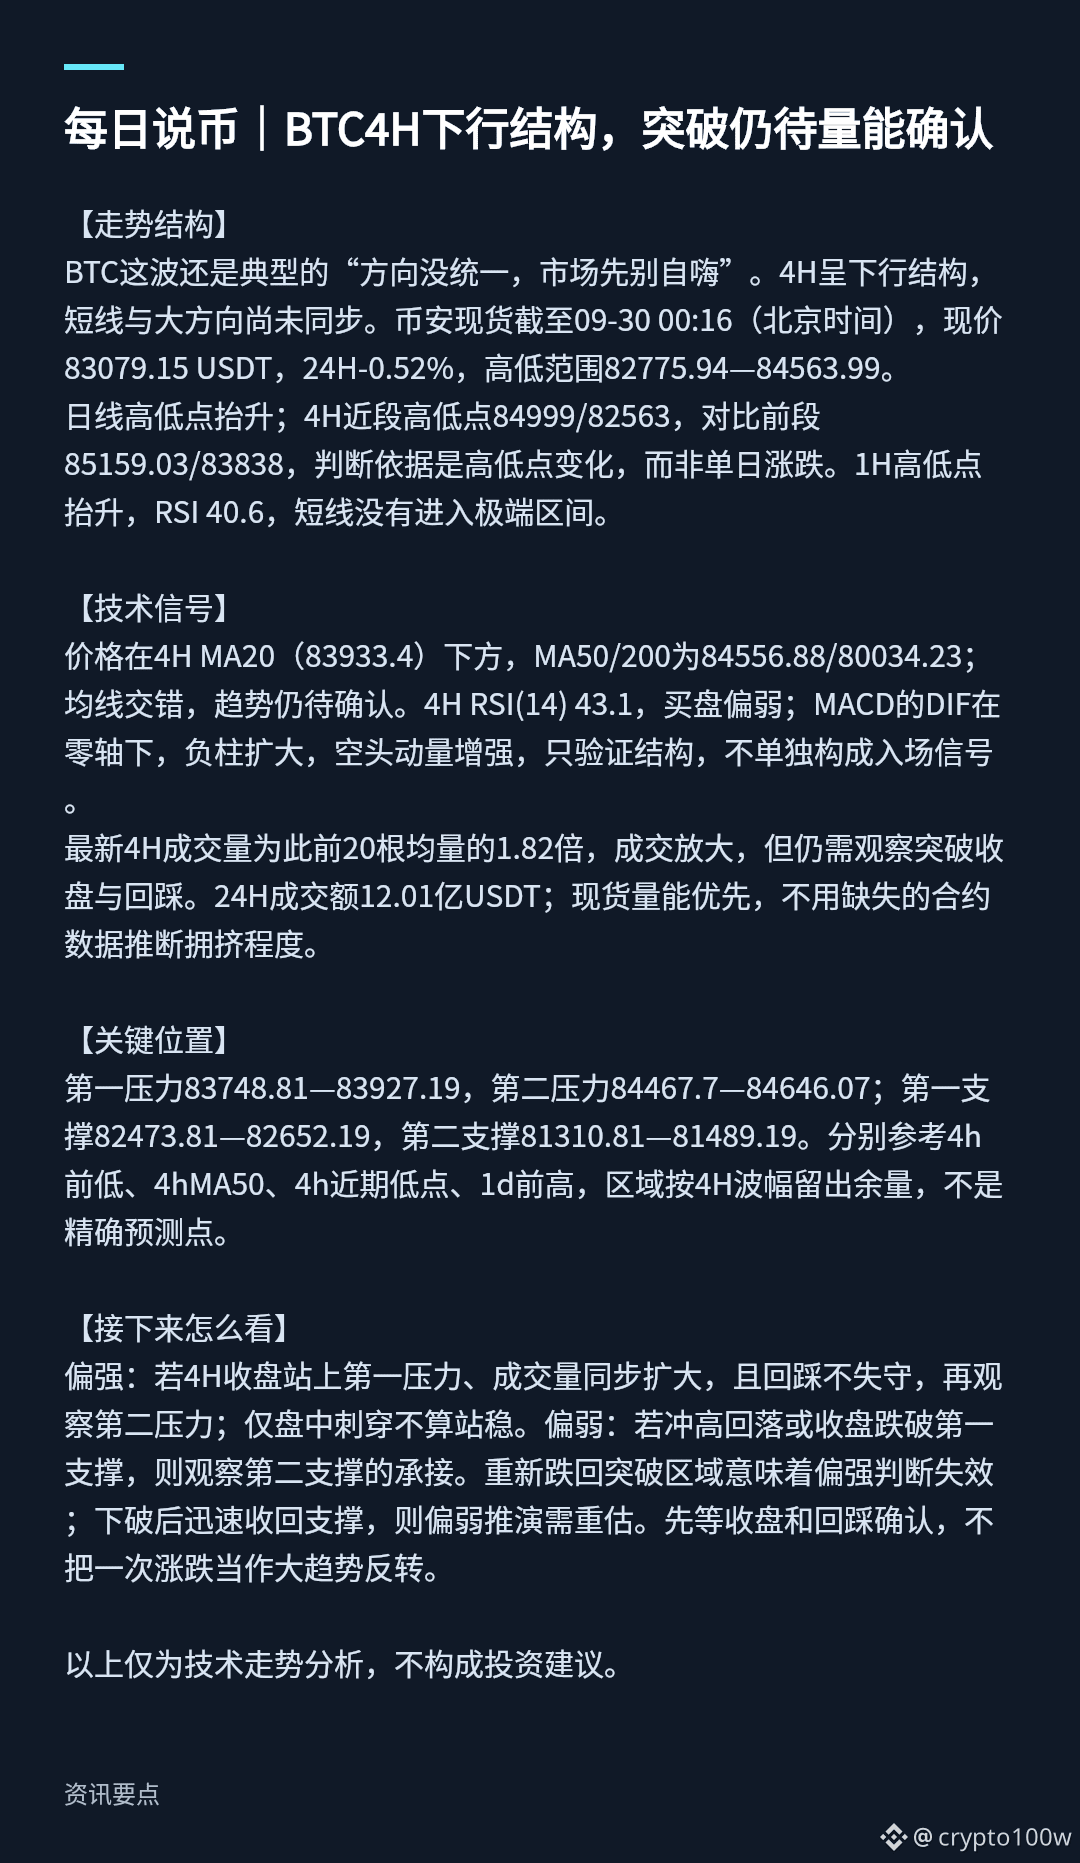
【Market Structure】
This BTC move is still a typical case of “directions not unified—don’t get too excited about the market first.” The 4H is in a downward structure, and the short-term and the bigger trend are not yet aligned. As of Binance Spot 09-30 00:16 (Beijing time), the current price is 83,079.15 USDT, down 0.52% over 24H, with a high-low range of 82,775.94—84,563.99.
On the daily chart, the high and low points are rising; on the 4H chart, the recent high/low points are 84,999/82,563. Compared with the prior segment’s 85,159.03/83,838, the judgment is based on changes in the highs/lows rather than a single day’s rise or fall. On the 1H chart, the high/low points are rising; RSI is 40.6, and the short term has not entered an extreme zone.
【Technical Signals】
Price is below the 4H MA20 (83,933.4). MA50/200 are 84,556.88/80,034.23; the moving averages are intertwined, and the trend still needs confirmation. 4H RSI(14) is 43.1, indicating the bid is weak. MACD’s DIF is below the zero axis, the negative histogram bars are expanding, and bearish momentum is increasing—this only validates the structure and does not, by itself, form an entry signal.
The latest 4H成交量 is 1.82 times the average volume of the previous 20 candles. Volume has expanded, but it still needs observation of a confirmed close and a successful retest. 24H trading value is 1.201 billion USDT; spot volume should be prioritized. Don’t infer crowding based on missing futures contract data.
【Key Levels】
First resistance: 83,748.81—83,927.19; second resistance: 84,467.7—84,646.07. First support: 82,473.81—82,652.19; second support: 81,310.81—81,489.19. Refer to the 4H prior low, 4H MA50, the recent 4H low, and the 1D prior high respectively. The zones allow some buffer based on the 4H swing range and are not precise prediction points.
【What to Watch Next】
Bullish: If the 4H closes above the first resistance with synchronized volume expansion, and the retest does not break down, then watch the second resistance. Piercing intraday alone does not count as holding.
Bearish: If the price spikes and then falls back, or if the close breaks below the first support, then watch how the second support holds. If price falls back into the breakout zone, the bullish view is invalid. After the breakdown, if support is quickly reclaimed, the bearish scenario needs to be reassessed. Wait first for the close and the retest confirmation—don’t treat a single rise/fall as a full trend reversal.
The above is only technical trend analysis and does not constitute investment advice.
This BTC move is still a typical case of “directions not unified—don’t get too excited about the market first.” The 4H is in a downward structure, and the short-term and the bigger trend are not yet aligned. As of Binance Spot 09-30 00:16 (Beijing time), the current price is 83,079.15 USDT, down 0.52% over 24H, with a high-low range of 82,775.94—84,563.99.
On the daily chart, the high and low points are rising; on the 4H chart, the recent high/low points are 84,999/82,563. Compared with the prior segment’s 85,159.03/83,838, the judgment is based on changes in the highs/lows rather than a single day’s rise or fall. On the 1H chart, the high/low points are rising; RSI is 40.6, and the short term has not entered an extreme zone.
【Technical Signals】
Price is below the 4H MA20 (83,933.4). MA50/200 are 84,556.88/80,034.23; the moving averages are intertwined, and the trend still needs confirmation. 4H RSI(14) is 43.1, indicating the bid is weak. MACD’s DIF is below the zero axis, the negative histogram bars are expanding, and bearish momentum is increasing—this only validates the structure and does not, by itself, form an entry signal.
The latest 4H成交量 is 1.82 times the average volume of the previous 20 candles. Volume has expanded, but it still needs observation of a confirmed close and a successful retest. 24H trading value is 1.201 billion USDT; spot volume should be prioritized. Don’t infer crowding based on missing futures contract data.
【Key Levels】
First resistance: 83,748.81—83,927.19; second resistance: 84,467.7—84,646.07. First support: 82,473.81—82,652.19; second support: 81,310.81—81,489.19. Refer to the 4H prior low, 4H MA50, the recent 4H low, and the 1D prior high respectively. The zones allow some buffer based on the 4H swing range and are not precise prediction points.
【What to Watch Next】
Bullish: If the 4H closes above the first resistance with synchronized volume expansion, and the retest does not break down, then watch the second resistance. Piercing intraday alone does not count as holding.
Bearish: If the price spikes and then falls back, or if the close breaks below the first support, then watch how the second support holds. If price falls back into the breakout zone, the bullish view is invalid. After the breakdown, if support is quickly reclaimed, the bearish scenario needs to be reassessed. Wait first for the close and the retest confirmation—don’t treat a single rise/fall as a full trend reversal.
The above is only technical trend analysis and does not constitute investment advice.