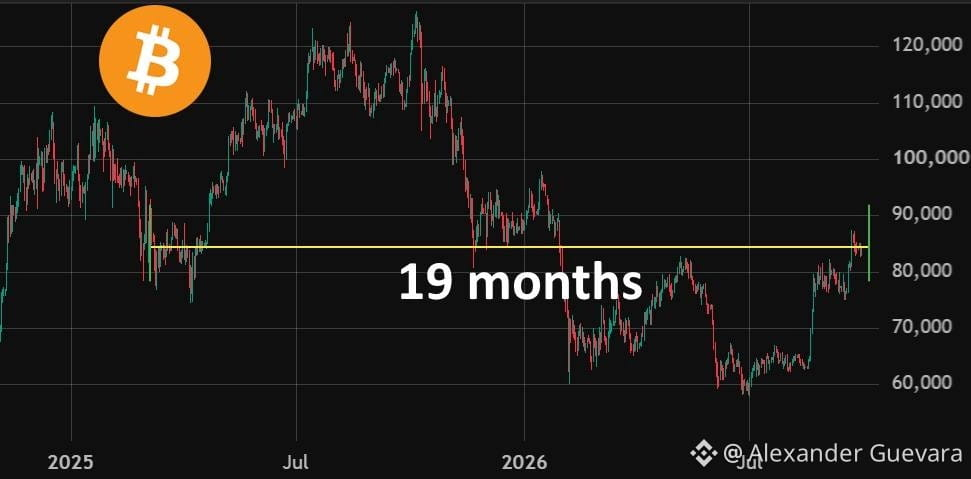
✅ Bitcoin is back to where it was 19 months ago...
🔥BIG BOMB🔥
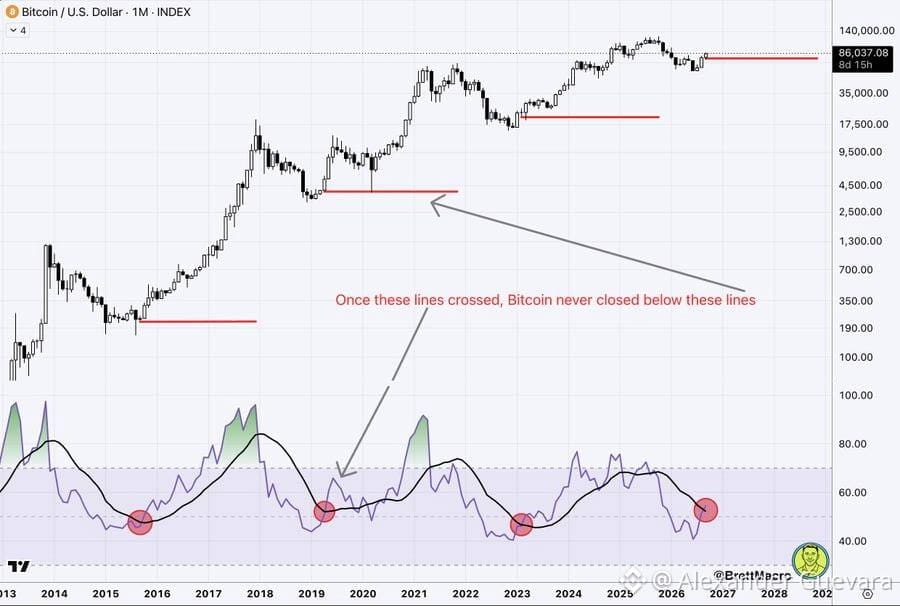
A SIGN THAT HAS NEVER FAILED IN #BITCOIN COULD BE ACTIVATING
👀 The 3 times it showed up, the price never went back down.
What is the monthly chart of #BTC indicating?!
🎯 The RSI measures the strength of an asset: whether it’s rising strongly or if it’s weakening.
🎯 When the monthly RSI crosses above its own average, it’s a sign that buying strength has returned.
👉 That cross has happened only 3 times in #Bitcoin’s history, and in all 3, the price never again closed a month below that level:
▪️ 2015: cross near $250. Two years later, #bitcoin reached almost $20,000.
▪️ 2019: cross near $4,000. In 2021 it surpassed $60,000.
▪️ 2023: cross near $20,000. In 2025 it marked its all-time high, above $126,000.
LAST NEWS: Jim Cramer says "I think a short squeeze in bonds could really happen."🟢
#RSI #TrendingPredictions #TradingSignals $BTC $WBTC
🔥BIG BOMB🔥
A SIGN THAT HAS NEVER FAILED IN #BITCOIN COULD BE ACTIVATING
👀 The 3 times it showed up, the price never went back down.
What is the monthly chart of #BTC indicating?!
🎯 The RSI measures the strength of an asset: whether it’s rising strongly or if it’s weakening.
🎯 When the monthly RSI crosses above its own average, it’s a sign that buying strength has returned.
👉 That cross has happened only 3 times in #Bitcoin’s history, and in all 3, the price never again closed a month below that level:
▪️ 2015: cross near $250. Two years later, #bitcoin reached almost $20,000.
▪️ 2019: cross near $4,000. In 2021 it surpassed $60,000.
▪️ 2023: cross near $20,000. In 2025 it marked its all-time high, above $126,000.
LAST NEWS: Jim Cramer says "I think a short squeeze in bonds could really happen."🟢
#RSI #TrendingPredictions #TradingSignals $BTC $WBTC