【A coin that went up 100x fell from a high point today 🔥⚖️】
Group chat: 💬 加入X先生的粉丝群聊
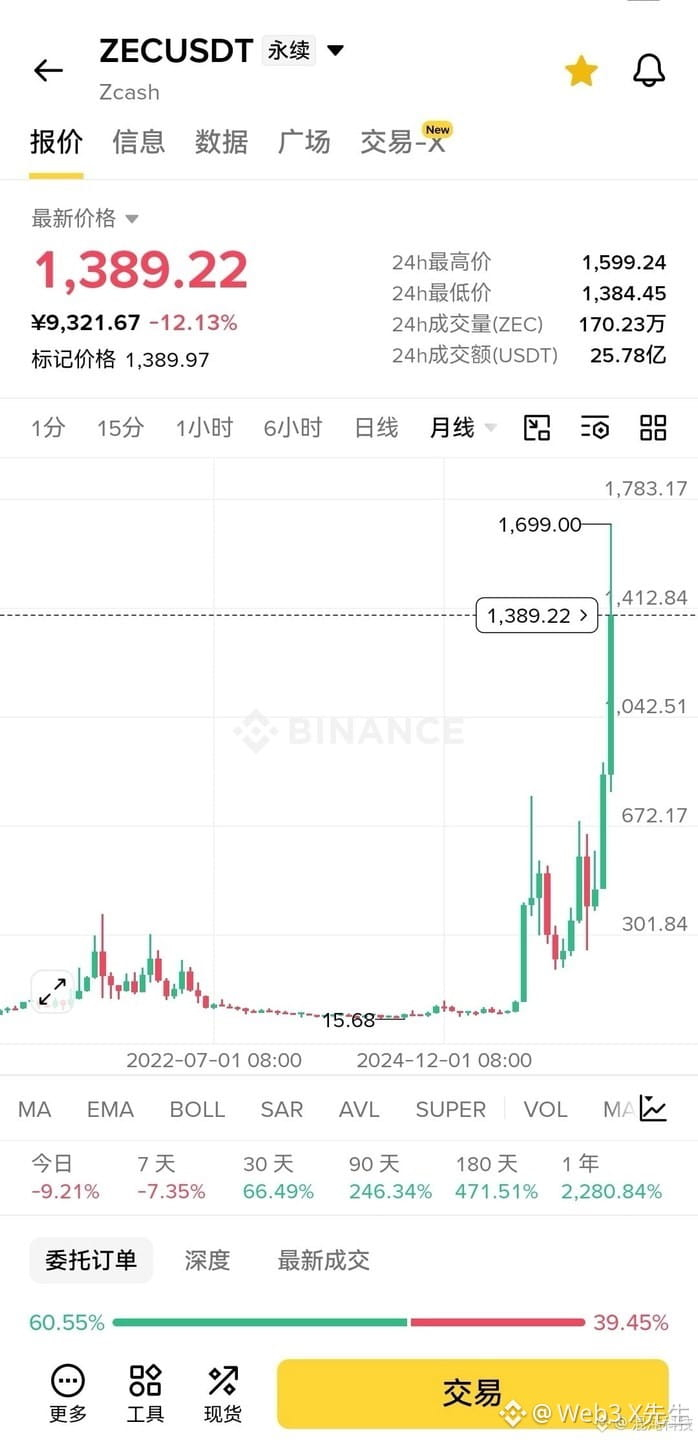
Two years and two months, up 100x. This is a set of numbers that has been brought up repeatedly in the square today. The protagonist is an old coin that focuses on privacy. It climbed steadily from July 2024. It even touched a high of $1,599. Today it has returned to around $1,452. In the past 24 hours, it’s down 7.7%. 😮💨
The drop isn’t calm. Trading volume has expanded to $388 million. It’s one of the most actively traded assets throughout the entire day. When a move occurs on increasing volume, it usually means someone is truly exiting—not just small, noisy fluctuations. This kind of volume usually only appears when the disagreement is at its most intense. 📉
What really matters is the position/lot (chip) structure. Someone on the square calculated the contract data. The long side’s average cost is around $1,071. Overall, there are still more than $70 million of unrealized profit under pressure. The nominal long-to-short ratio has been pushed to 710%. The longs are more than 7 times the shorts. Over on the side with fewer people, everyone is actually making money. ⚖️
If you break it down another layer, it gets even more painful. Out of 1,174 long positions, only 26.8% are in profit. The rest are mostly chasing in above $1,400. On the short side, there are 592 accounts—81.9% are profitable. The older longs hold higher up; the newer longs are hanging in midair. 😬
I’ve seen this kind of structure many times. The price is still high. The factor that truly determines the direction isn’t the people shouting “go long.” It’s whether the batch of traders sitting at lower levels is willing to keep holding. Once unrealized gains shrink to a certain point, sell orders will appear on their own. No need to wait for bad news. 🧭
My view is: the long-term story is still there, but the short-term rhythm has already changed. Don’t try to guess the top—watch it instead by tracking the cost line of the older longs. That’s what switches this round of volatility on and off. 🔍
📌 When a selloff happens with volume at high levels, watching the cost of long positions is more useful than watching the candlestick chart.
If you have low-cost positions, will you take profits first or keep holding?
Group chat: 💬 加入X先生的粉丝群聊
Two years and two months, up 100x. This is a set of numbers that has been brought up repeatedly in the square today. The protagonist is an old coin that focuses on privacy. It climbed steadily from July 2024. It even touched a high of $1,599. Today it has returned to around $1,452. In the past 24 hours, it’s down 7.7%. 😮💨
The drop isn’t calm. Trading volume has expanded to $388 million. It’s one of the most actively traded assets throughout the entire day. When a move occurs on increasing volume, it usually means someone is truly exiting—not just small, noisy fluctuations. This kind of volume usually only appears when the disagreement is at its most intense. 📉
What really matters is the position/lot (chip) structure. Someone on the square calculated the contract data. The long side’s average cost is around $1,071. Overall, there are still more than $70 million of unrealized profit under pressure. The nominal long-to-short ratio has been pushed to 710%. The longs are more than 7 times the shorts. Over on the side with fewer people, everyone is actually making money. ⚖️
If you break it down another layer, it gets even more painful. Out of 1,174 long positions, only 26.8% are in profit. The rest are mostly chasing in above $1,400. On the short side, there are 592 accounts—81.9% are profitable. The older longs hold higher up; the newer longs are hanging in midair. 😬
I’ve seen this kind of structure many times. The price is still high. The factor that truly determines the direction isn’t the people shouting “go long.” It’s whether the batch of traders sitting at lower levels is willing to keep holding. Once unrealized gains shrink to a certain point, sell orders will appear on their own. No need to wait for bad news. 🧭
My view is: the long-term story is still there, but the short-term rhythm has already changed. Don’t try to guess the top—watch it instead by tracking the cost line of the older longs. That’s what switches this round of volatility on and off. 🔍
📌 When a selloff happens with volume at high levels, watching the cost of long positions is more useful than watching the candlestick chart.
If you have low-cost positions, will you take profits first or keep holding?