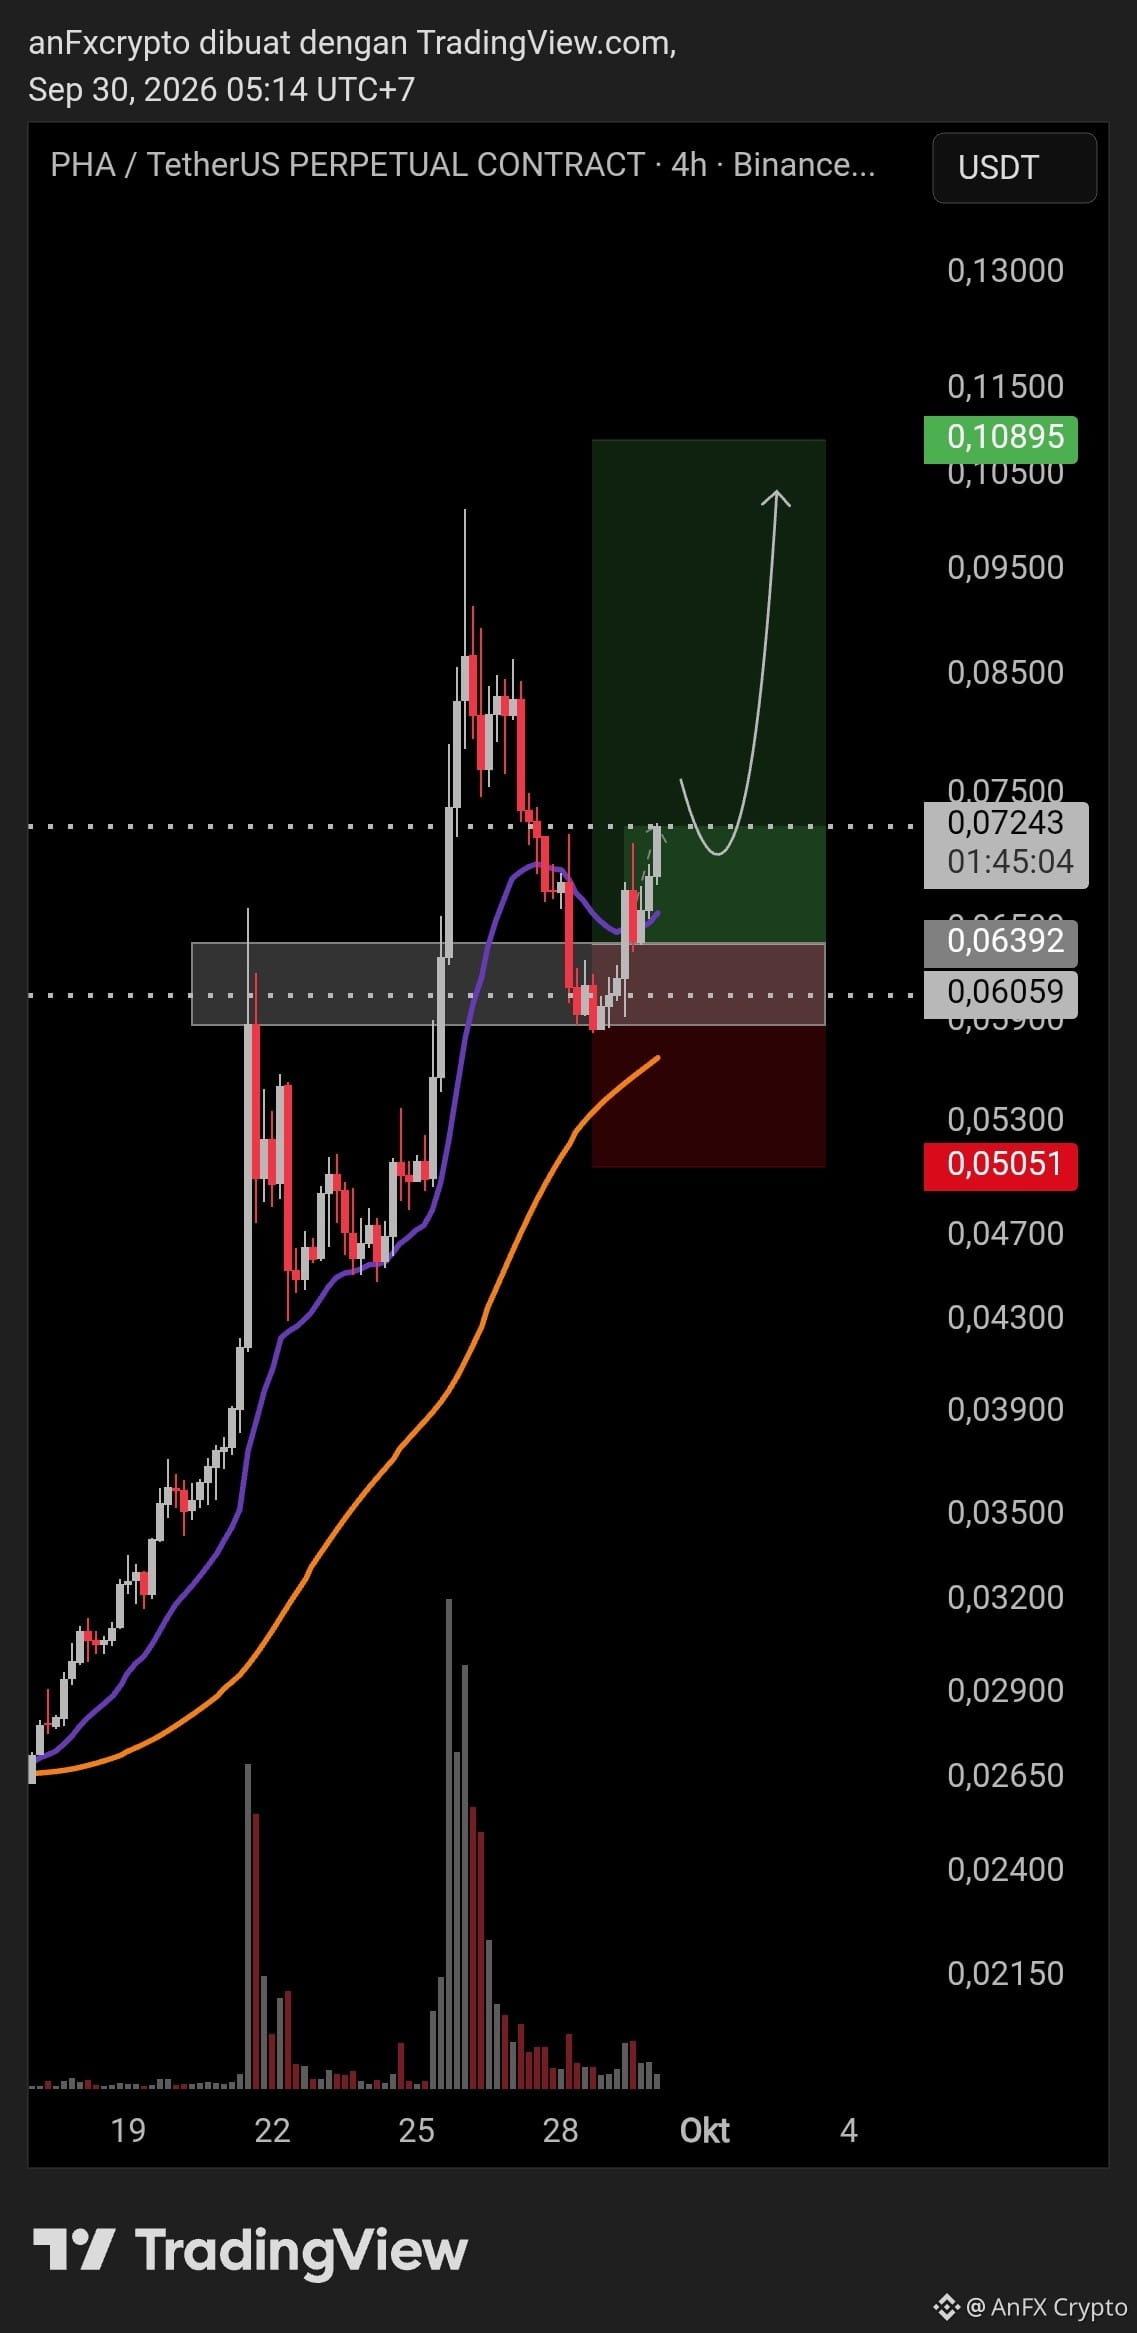
Based on technical analysis on the chart $PHA /USDT Perpetual (Timeframe 4 Hours / 4H):
1. Market Structure Analysis & Indicators
Trend Structure: The market is currently in a Bullish Continuation structure. After experiencing an impulsive price move (impulsive wave) toward the local peak area around ~0.098, the price made a healthy correction toward the Demand Zone / Order Block in the range of 0.06059 – 0.06392.
Support Reaction: A strong bounce occurred from the Demand area, supported by the intersection of dynamic Moving Average (MA) lines acting as support.
Volume: Selling volume during the correction decreased drastically (declining volume), indicating that selling pressure is weakening and that the lower area is being utilized by buyers for re-accumulation.
2. Signals & Trading Plan (LONG Setup)
Parameter | Price Level | Market Bias
Entry Zone (Buy/Long): 0.07000 – 0.07250 (or wait for a light dip toward the re-test area)
Take Profit 1 (TP 1): 0.08500 (Local resistance area)
Take Profit 2 (TP 2): 0.09800 (Major Swing High)
Take Profit 3 (TP 3 / Main Target): 0.10895 (Main target according to the chart projection)
Stop Loss (SL): 0.05051 (Below the lower boundary of the Demand Zone)
3. Risk Management & Execution Notes
Risk to Reward Ratio (RRR): Around 1 : 2.5+, making this risk-to-potential-profit ratio very ideal for swing trading.
Capital Management: Limit maximum risk to 1% – 2% of your account’s total equity for this trade.
Leverage: If using Futures/Perpetual contracts, it is recommended to use controlled leverage (e.g., 3x – 5x) to avoid extreme volatility.
Invalidation Scenario: If price closes (4H candle close) below the 0.06000 area, the bullish structure fails and it is recommended to be disciplined with a cut loss or capital preservation.
1. Market Structure Analysis & Indicators
Trend Structure: The market is currently in a Bullish Continuation structure. After experiencing an impulsive price move (impulsive wave) toward the local peak area around ~0.098, the price made a healthy correction toward the Demand Zone / Order Block in the range of 0.06059 – 0.06392.
Support Reaction: A strong bounce occurred from the Demand area, supported by the intersection of dynamic Moving Average (MA) lines acting as support.
Volume: Selling volume during the correction decreased drastically (declining volume), indicating that selling pressure is weakening and that the lower area is being utilized by buyers for re-accumulation.
2. Signals & Trading Plan (LONG Setup)
Parameter | Price Level | Market Bias
Entry Zone (Buy/Long): 0.07000 – 0.07250 (or wait for a light dip toward the re-test area)
Take Profit 1 (TP 1): 0.08500 (Local resistance area)
Take Profit 2 (TP 2): 0.09800 (Major Swing High)
Take Profit 3 (TP 3 / Main Target): 0.10895 (Main target according to the chart projection)
Stop Loss (SL): 0.05051 (Below the lower boundary of the Demand Zone)
3. Risk Management & Execution Notes
Risk to Reward Ratio (RRR): Around 1 : 2.5+, making this risk-to-potential-profit ratio very ideal for swing trading.
Capital Management: Limit maximum risk to 1% – 2% of your account’s total equity for this trade.
Leverage: If using Futures/Perpetual contracts, it is recommended to use controlled leverage (e.g., 3x – 5x) to avoid extreme volatility.
Invalidation Scenario: If price closes (4H candle close) below the 0.06000 area, the bullish structure fails and it is recommended to be disciplined with a cut loss or capital preservation.