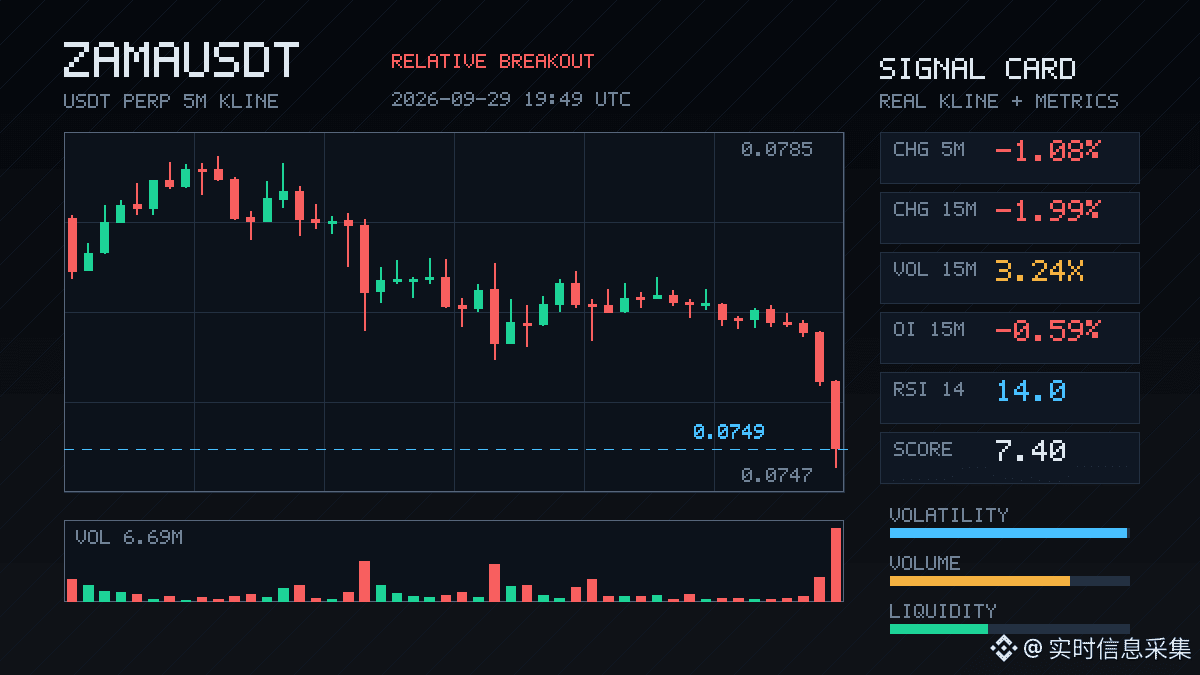
$ZAMA This spot is interesting.
15m: it directly breaks below the lower bound of the past 20 5m candles. Trading volume surges to 3.24x. Taker volume difference is -33.8%, and the buy/sell ratio is 0.49. Clearly, someone is dumping it outward. But the key point isn’t that single bearish candle itself—OI: 1h -0.71%, nominally down 410k U. Combined with the price drop, this is a typical deleveraging by longs, not new shorts entering.
In other words, this is longs triggering their own panic sell, not shorts chasing it.
What’s even more worth watching is that the OI anomalous percentile is 99.8%—the highest in the whole pool—and it has continued across multiple consecutive periods. At this level of abnormality, it usually won’t end with just one 15m candle. The funding rate is still in a high percentile recently as well, suggesting the longs who crowded in earlier haven’t fully been shaken out yet.
My take: this kind of deleveraging-driven selloff may still have some short-term momentum, but once OI contraction is in place and the funding rate normalizes, it often becomes easier to see a rebound structure form. Right now, chasing shorts isn’t the best risk/reward. Waiting for signals that OI has stabilized is more reliable.
Not investment advice—manage your position based on your own judgment.
15m: it directly breaks below the lower bound of the past 20 5m candles. Trading volume surges to 3.24x. Taker volume difference is -33.8%, and the buy/sell ratio is 0.49. Clearly, someone is dumping it outward. But the key point isn’t that single bearish candle itself—OI: 1h -0.71%, nominally down 410k U. Combined with the price drop, this is a typical deleveraging by longs, not new shorts entering.
In other words, this is longs triggering their own panic sell, not shorts chasing it.
What’s even more worth watching is that the OI anomalous percentile is 99.8%—the highest in the whole pool—and it has continued across multiple consecutive periods. At this level of abnormality, it usually won’t end with just one 15m candle. The funding rate is still in a high percentile recently as well, suggesting the longs who crowded in earlier haven’t fully been shaken out yet.
My take: this kind of deleveraging-driven selloff may still have some short-term momentum, but once OI contraction is in place and the funding rate normalizes, it often becomes easier to see a rebound structure form. Right now, chasing shorts isn’t the best risk/reward. Waiting for signals that OI has stabilized is more reliable.
Not investment advice—manage your position based on your own judgment.