📉 DEBIT IS TRYING TO TURN THE SELL-OFF INTO A BASE
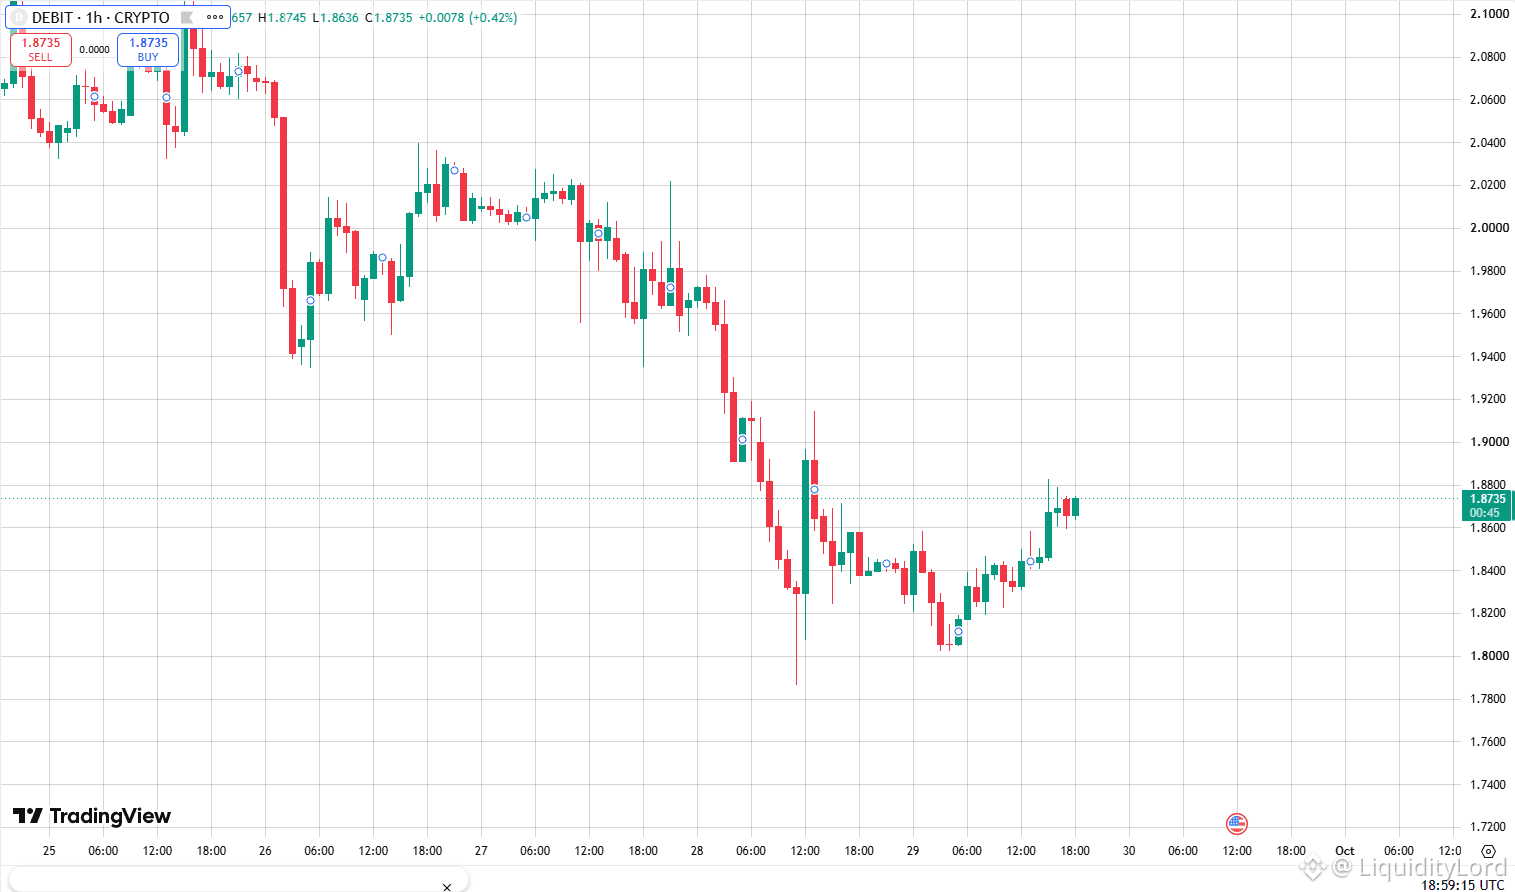
DEBIT on the 1H chart is around 1.873 after a prolonged decline from above 2.08. Price fell through 2.00, accelerated toward 1.78, and then started building a recovery. It is now pushing into the first meaningful resistance zone.
🧭 THE STRUCTURE IS CHANGING
The broader trend remains bearish, but the latest sequence is different. After the flush, sellers failed to extend below 1.80. Buyers then formed higher lows around 1.82–1.84 and lifted price toward 1.87. This is an early attempt to change the short-term rhythm.
1.80–1.82 → major reaction low
1.82–1.84 → developing support
1.86–1.88 → current pivot
1.90–1.92 → first resistance
1.94–1.96 → recovery checkpoint
2.00–2.02 → major overhead supply
🔎 THE RECLAIM TEST
The latest candles show recovery from 1.81, but price is approaching 1.88–1.90 where selling previously appeared. A clean hold above 1.86 on this timeframe keeps the higher-low structure intact. Rejection followed by a move under 1.82 would weaken the bounce.
🎯 THE LEVELS THAT MATTER
A controlled long scenario becomes interesting around 1.86–1.88 after a hold or reclaim. Invalidation sits below 1.82 on sustained acceptance.
TP1 → 1.92
TP2 → 1.96
TP3 → 2.02
The first target is the immediate recovery barrier. A move through 1.96 would put the old 2.00–2.02 supply area back into focus, while failure at 1.90 keeps DEBIT inside the broader downtrend.
⚙ THE DEFI ANGLE
ST0Nfi brings a separate protocol perspective through liquidity, execution and ecosystem participation. That utility belongs to a different DeFi layer and does not validate DEBIT's chart structure. Here, price action remains the primary evidence.
For DEBIT, the key question is whether 1.86–1.88 becomes support. Hold it and the chart can continue toward 1.92, 1.96 and 2.02. Lose 1.82 and the base attempt becomes weaker.
NFA - DYOR
$DEBIT
DEBIT on the 1H chart is around 1.873 after a prolonged decline from above 2.08. Price fell through 2.00, accelerated toward 1.78, and then started building a recovery. It is now pushing into the first meaningful resistance zone.
🧭 THE STRUCTURE IS CHANGING
The broader trend remains bearish, but the latest sequence is different. After the flush, sellers failed to extend below 1.80. Buyers then formed higher lows around 1.82–1.84 and lifted price toward 1.87. This is an early attempt to change the short-term rhythm.
1.80–1.82 → major reaction low
1.82–1.84 → developing support
1.86–1.88 → current pivot
1.90–1.92 → first resistance
1.94–1.96 → recovery checkpoint
2.00–2.02 → major overhead supply
🔎 THE RECLAIM TEST
The latest candles show recovery from 1.81, but price is approaching 1.88–1.90 where selling previously appeared. A clean hold above 1.86 on this timeframe keeps the higher-low structure intact. Rejection followed by a move under 1.82 would weaken the bounce.
🎯 THE LEVELS THAT MATTER
A controlled long scenario becomes interesting around 1.86–1.88 after a hold or reclaim. Invalidation sits below 1.82 on sustained acceptance.
TP1 → 1.92
TP2 → 1.96
TP3 → 2.02
The first target is the immediate recovery barrier. A move through 1.96 would put the old 2.00–2.02 supply area back into focus, while failure at 1.90 keeps DEBIT inside the broader downtrend.
⚙ THE DEFI ANGLE
ST0Nfi brings a separate protocol perspective through liquidity, execution and ecosystem participation. That utility belongs to a different DeFi layer and does not validate DEBIT's chart structure. Here, price action remains the primary evidence.
For DEBIT, the key question is whether 1.86–1.88 becomes support. Hold it and the chart can continue toward 1.92, 1.96 and 2.02. Lose 1.82 and the base attempt becomes weaker.
NFA - DYOR
$DEBIT