$PEPE
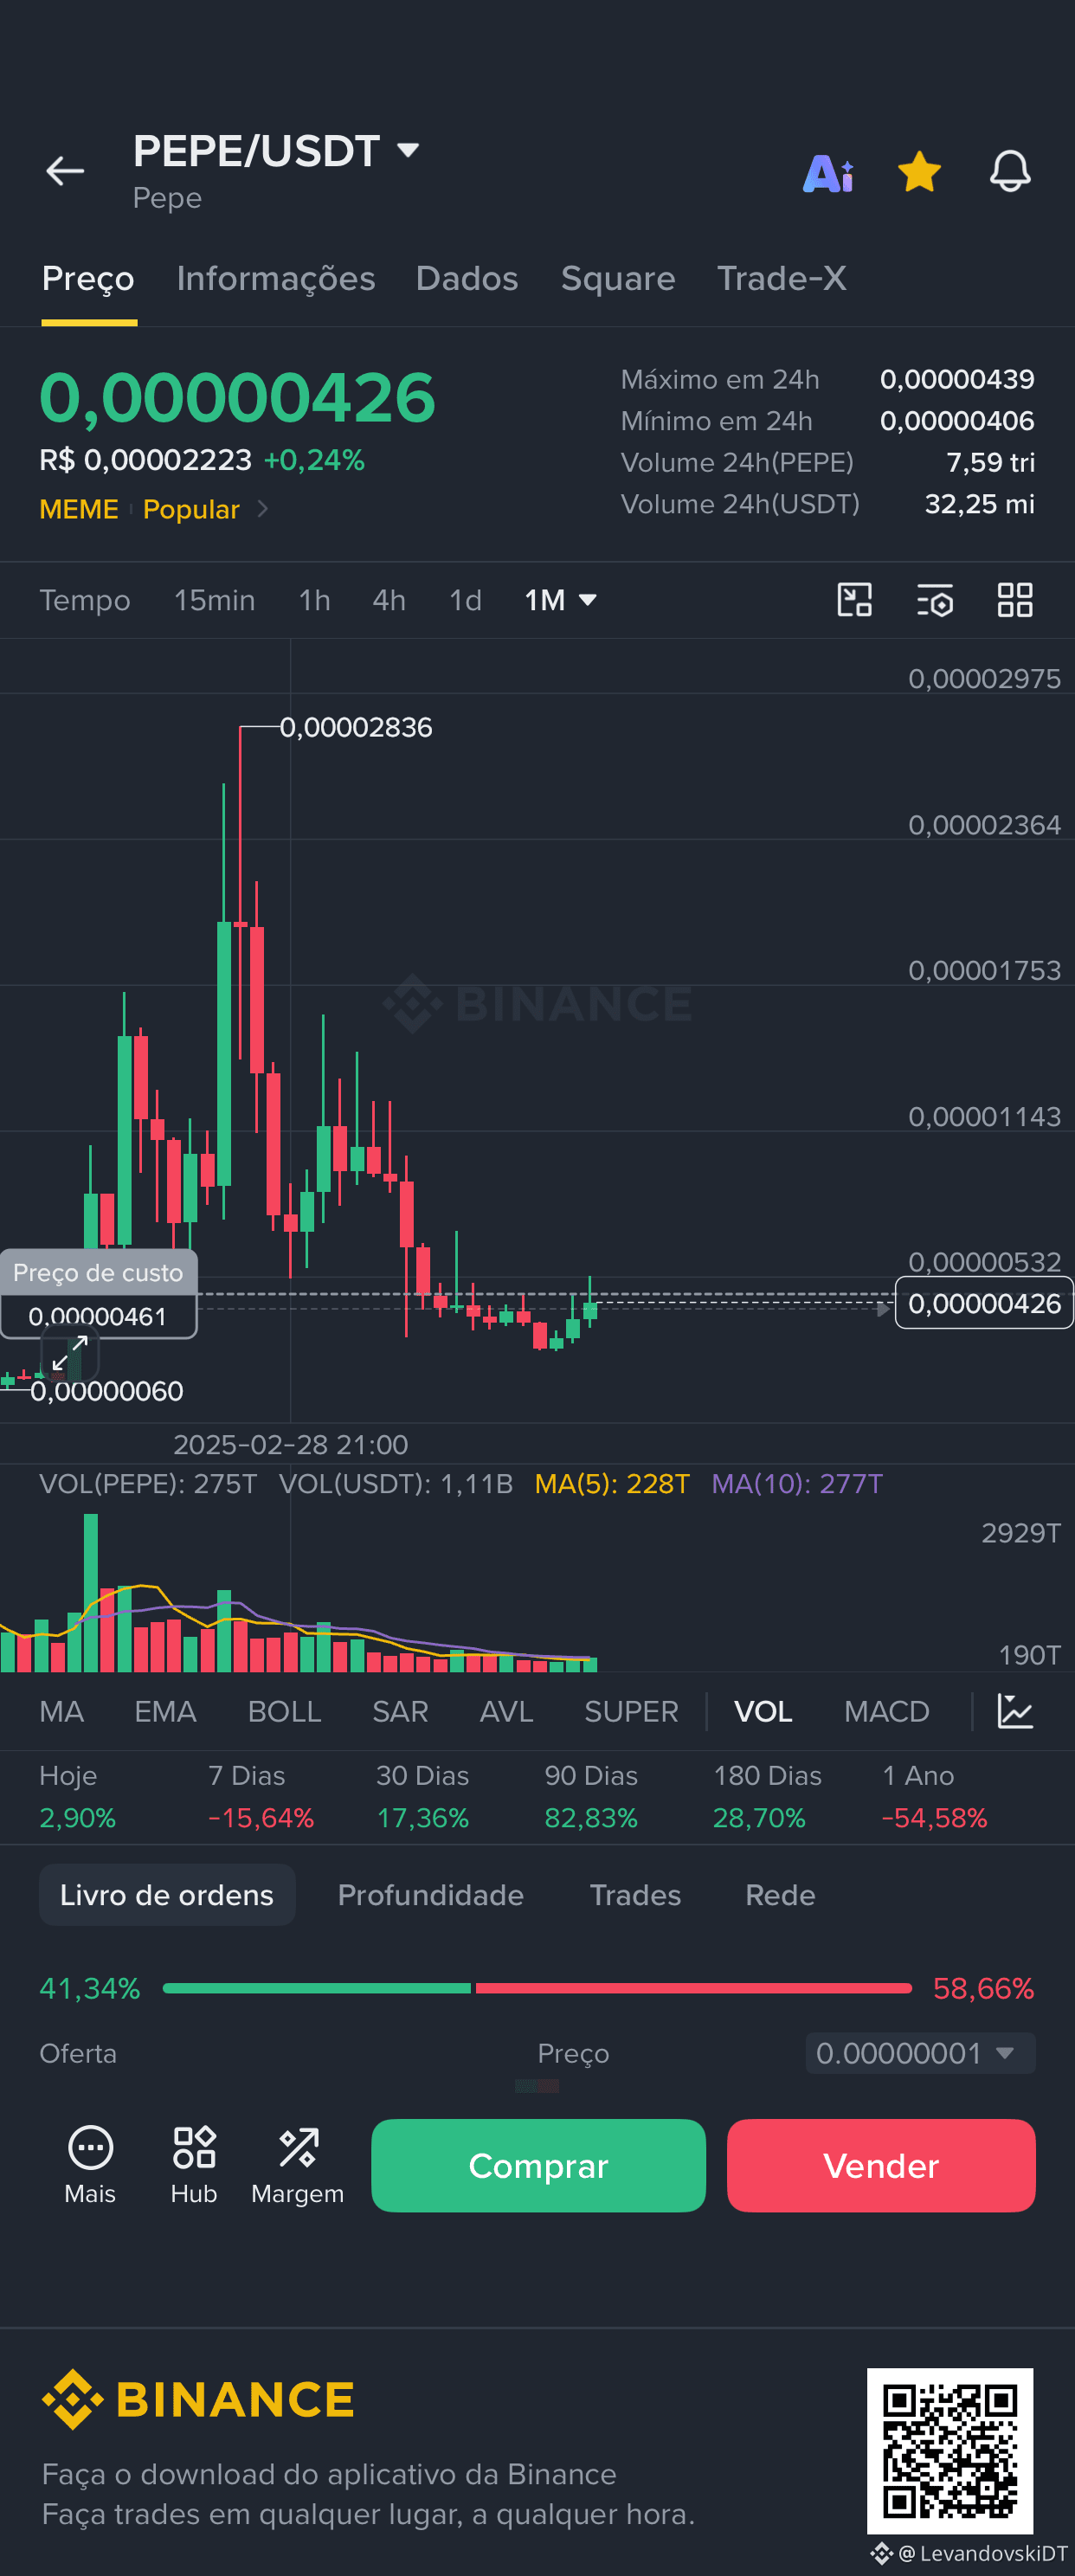
#pepe 🚨🚨🚨🚨👇🏻👇🏻👇🏻👇🏻👇🏻📉📉📉📉This PEPE/USDT screenshot on Binance clearly shows the reality of a memecoin:
In the 1M chart, PEPE made an explosive top at 0,00002836 USDT — a totally out-of-the-curve pump — and now it’s at 0,00000426 USDT.
That’s a drop of more than 85% from the peak. What you’re seeing is a classic memecoin cycle: euphoria + FOMO pushes the price up, then strong profit-taking comes in and the price plunges until it finds a bottom.
Today it’s trading sideways/consolidating in the 0,00000406 to 0,00000439 range. Volume has fallen a lot — VOL(PEPE) is 275T versus an average of 228T/277T — and in the indicators, the month is down -15,64% over the last 7 days. Your cost basis is 0,00000461, so you’re slightly in the red.
It’s up +0,24% now, but it’s just a technical breather. There isn’t enough buying strength to talk about a bounce yet today.
Should we expect a bounce today?
Very unlikely. Without an increase in volume and without Bitcoin pulling the meme market, it should keep moving sideways or test support at 0,00000406. A bounce only happens if the 24h volume (today 32,25 mi) spikes again.
It’s a time to observe, not to panic. Memes are like this: they go up in an elevator and come down by parachute, then they spend months going sideways.
#pepe 🚨🚨🚨🚨👇🏻👇🏻👇🏻👇🏻👇🏻📉📉📉📉This PEPE/USDT screenshot on Binance clearly shows the reality of a memecoin:
In the 1M chart, PEPE made an explosive top at 0,00002836 USDT — a totally out-of-the-curve pump — and now it’s at 0,00000426 USDT.
That’s a drop of more than 85% from the peak. What you’re seeing is a classic memecoin cycle: euphoria + FOMO pushes the price up, then strong profit-taking comes in and the price plunges until it finds a bottom.
Today it’s trading sideways/consolidating in the 0,00000406 to 0,00000439 range. Volume has fallen a lot — VOL(PEPE) is 275T versus an average of 228T/277T — and in the indicators, the month is down -15,64% over the last 7 days. Your cost basis is 0,00000461, so you’re slightly in the red.
It’s up +0,24% now, but it’s just a technical breather. There isn’t enough buying strength to talk about a bounce yet today.
Should we expect a bounce today?
Very unlikely. Without an increase in volume and without Bitcoin pulling the meme market, it should keep moving sideways or test support at 0,00000406. A bounce only happens if the 24h volume (today 32,25 mi) spikes again.
It’s a time to observe, not to panic. Memes are like this: they go up in an elevator and come down by parachute, then they spend months going sideways.