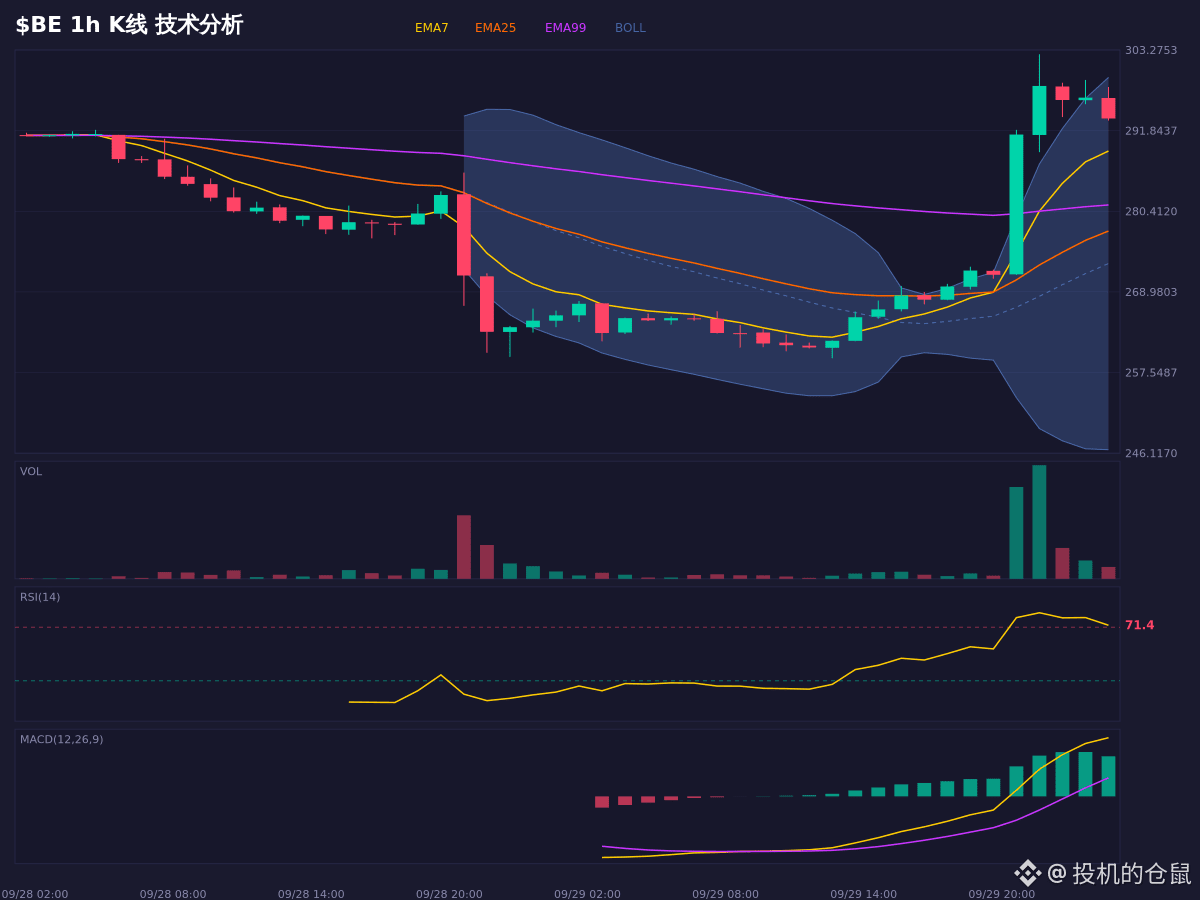
$BE This trend is quite interesting: in the short term, the moving averages are in a bullish alignment, but the RSI has already surged into the 70+ overbought zone—an all-too-familiar late-stage “strong bow, last shot” type signal. The MACD histogram is shrinking, but bullish momentum is still there, suggesting there may be a bit more room to the upside; however, chasing at this level carries significant risk.
OBV shows a steady inflow of funds, which is a fairly solid signal—at least it confirms that buy-side demand is indeed stronger than the sell-side. The long/short ratio is 1.22, and long positions are declining, indicating that some people have started taking profits.
If price holds above and consolidates within the 281–286 Fibonacci retracement range, the bullish structure could continue; but if it breaks below 273.67, the current logic will fail. At this point, it’s clearly better to wait for a pullback rather than chase.
For observation of the chart and scenario analysis only; it does not constitute a record of trading actions.
$BE #合约 #现货 #交易
OBV shows a steady inflow of funds, which is a fairly solid signal—at least it confirms that buy-side demand is indeed stronger than the sell-side. The long/short ratio is 1.22, and long positions are declining, indicating that some people have started taking profits.
If price holds above and consolidates within the 281–286 Fibonacci retracement range, the bullish structure could continue; but if it breaks below 273.67, the current logic will fail. At this point, it’s clearly better to wait for a pullback rather than chase.
For observation of the chart and scenario analysis only; it does not constitute a record of trading actions.
$BE #合约 #现货 #交易