THE GAP BETWEEN THE RICH AND THE POOR IN THE U.S. EXPANDS INTO A RECORD BREAK: THE TOP 0.1% GROUP REAPS $4.44 TRILLION IN ASSET WEALTH
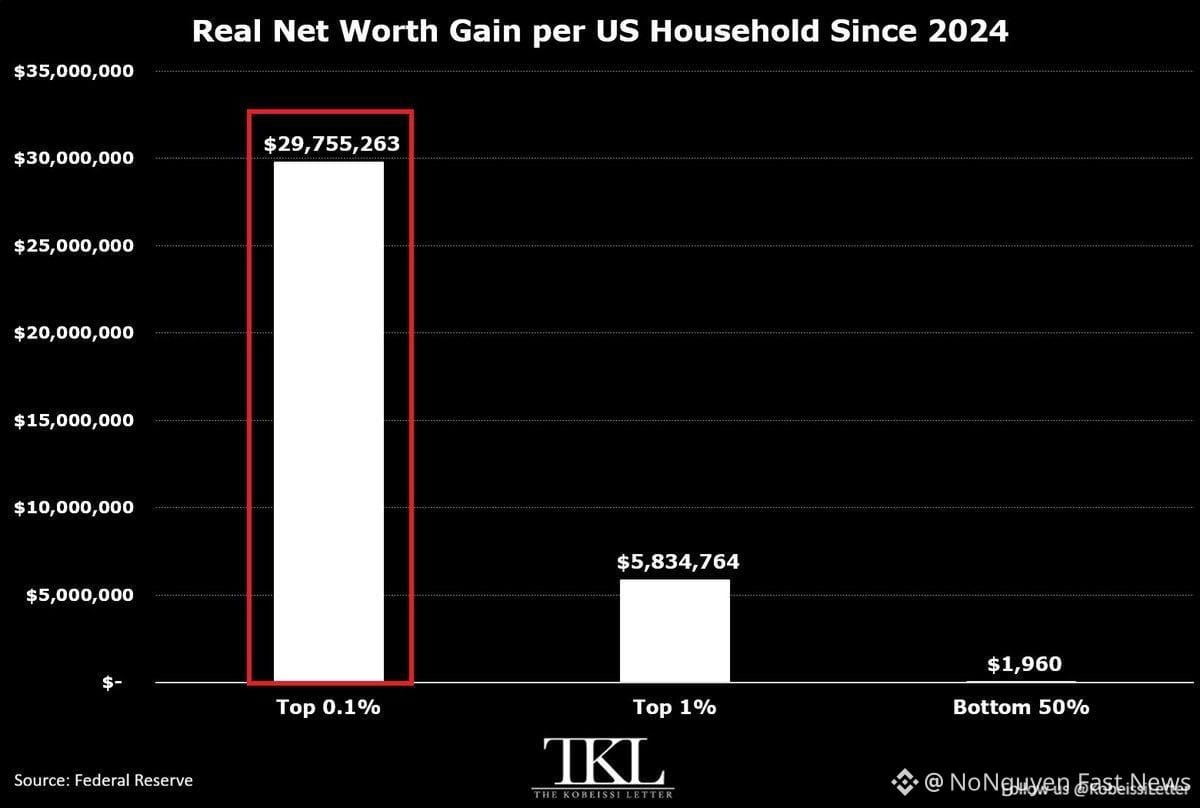
The average wealth gap surges dramatically: Inflation-adjusted data from Q4 2024 to Q2 2026 shows a sudden spike in net wealth inequality in the U.S.; on average, households in the richest Top 0.1% group pocket an additional $29.76 million, the Top 1% group rises by an additional $5.83 million, while the bottom 50% of households on the lowest rung record only a modest increase of $1,960.
The total net worth of the top 0.1% at the peak of the pyramid has climbed by as much as $4.44 trillion; conversely, the entire lower half of the population’s accumulation in the same period amounts to only about $198 billion.
This phenomenon reflects the fundamental nature of how the economy’s resources are allocated—where cash flow and the growth in the value of stocks, real estate, and business equity automatically flow toward groups that already own substantial capital assets, rather than relying purely on net wage income.
Personal assessment: These data lay bare the nature of monetary policy and the liquidity-injection cycle in the recent period. When the prices of risky assets and owner’s equity surge exponentially, groups that hold income-generating assets are perfectly protected from inflation and see net wealth grow at an exponential pace, while the working class only accumulates cash and suffers from a steady erosion of purchasing power. In the long run, widening asset disparities will weaken the sustainable purchasing power of the broader macroeconomy and push more small-scale capital toward alternative investment channels with higher leverage in search of opportunities to change their standing.
$ZEC $SUI $TAO
The average wealth gap surges dramatically: Inflation-adjusted data from Q4 2024 to Q2 2026 shows a sudden spike in net wealth inequality in the U.S.; on average, households in the richest Top 0.1% group pocket an additional $29.76 million, the Top 1% group rises by an additional $5.83 million, while the bottom 50% of households on the lowest rung record only a modest increase of $1,960.
The total net worth of the top 0.1% at the peak of the pyramid has climbed by as much as $4.44 trillion; conversely, the entire lower half of the population’s accumulation in the same period amounts to only about $198 billion.
This phenomenon reflects the fundamental nature of how the economy’s resources are allocated—where cash flow and the growth in the value of stocks, real estate, and business equity automatically flow toward groups that already own substantial capital assets, rather than relying purely on net wage income.
Personal assessment: These data lay bare the nature of monetary policy and the liquidity-injection cycle in the recent period. When the prices of risky assets and owner’s equity surge exponentially, groups that hold income-generating assets are perfectly protected from inflation and see net wealth grow at an exponential pace, while the working class only accumulates cash and suffers from a steady erosion of purchasing power. In the long run, widening asset disparities will weaken the sustainable purchasing power of the broader macroeconomy and push more small-scale capital toward alternative investment channels with higher leverage in search of opportunities to change their standing.
$ZEC $SUI $TAO