


We present you with a comprehensive technical analysis of Apple Inc. (Apple) based on price channels and momentum indicators on short timeframes (1 hour / 4 hours), to identify the strongest available trading opportunities:
📉 Current price situation:
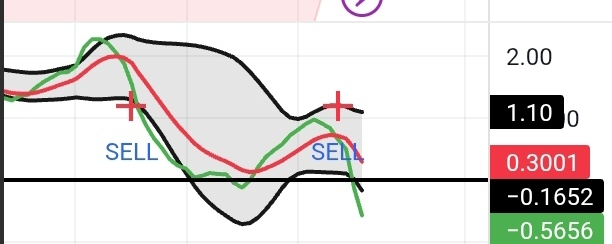
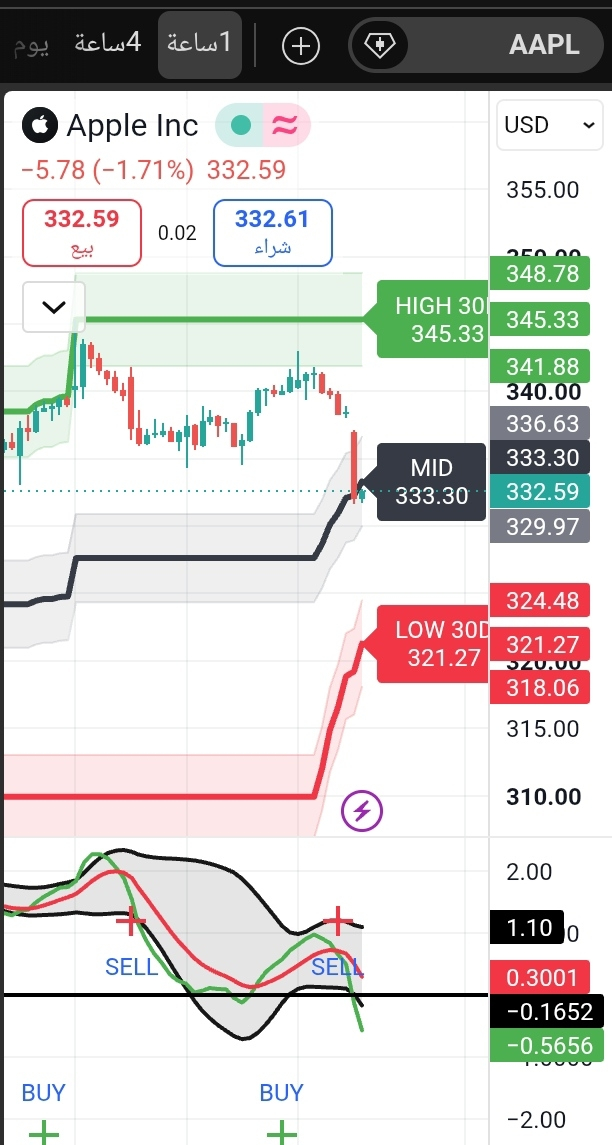
The stock is currently trading at $332.59, staying below the central pivot point ($333.30). Momentum indicators at the bottom are showing a negative crossover along with a SELL signal, suggesting the possibility of continued temporary selling pressure toward support zones before any bullish rebound.
🗺️ Map of Critical Levels (the next 30 days):
🎯 Upside Targets (HIGH): $341.88 | $345.33 | $348.78
📍 Pivot Point (MID): $333.30
🛡️ Support and Buy Zones (LOW): $324.48 | $321.27 | $318.06
🎯 Suggested Trading Strategies (Recommendations):
🟢 Scenario One: Buy on the bounce (the strongest and safest)
Entry Zone: Wait for the price to fall back to between $321.27 and $324.48 (watch for a bounce signal).
First Target: $333.30
Second Target: $341.88
Stop Loss (SL): Close the 4-hour candle below $318.06.
🔵 Scenario Two: Buy after the breakout
Entry Form: If the price action successfully breaks through and holds above the level of $333.30.
First Target: $341.88
Second Target: $345.33
Stop Loss (SL): Return and close below $329.90.
⚠️ Disclaimer: Please always match the chart with the real-time prices shown in your portfolio before execution, and strictly adhere to risk/capital management and activate stop-loss orders.