$0G
🚨 Technical analysis for $OG | A crucial zone after the strong rise
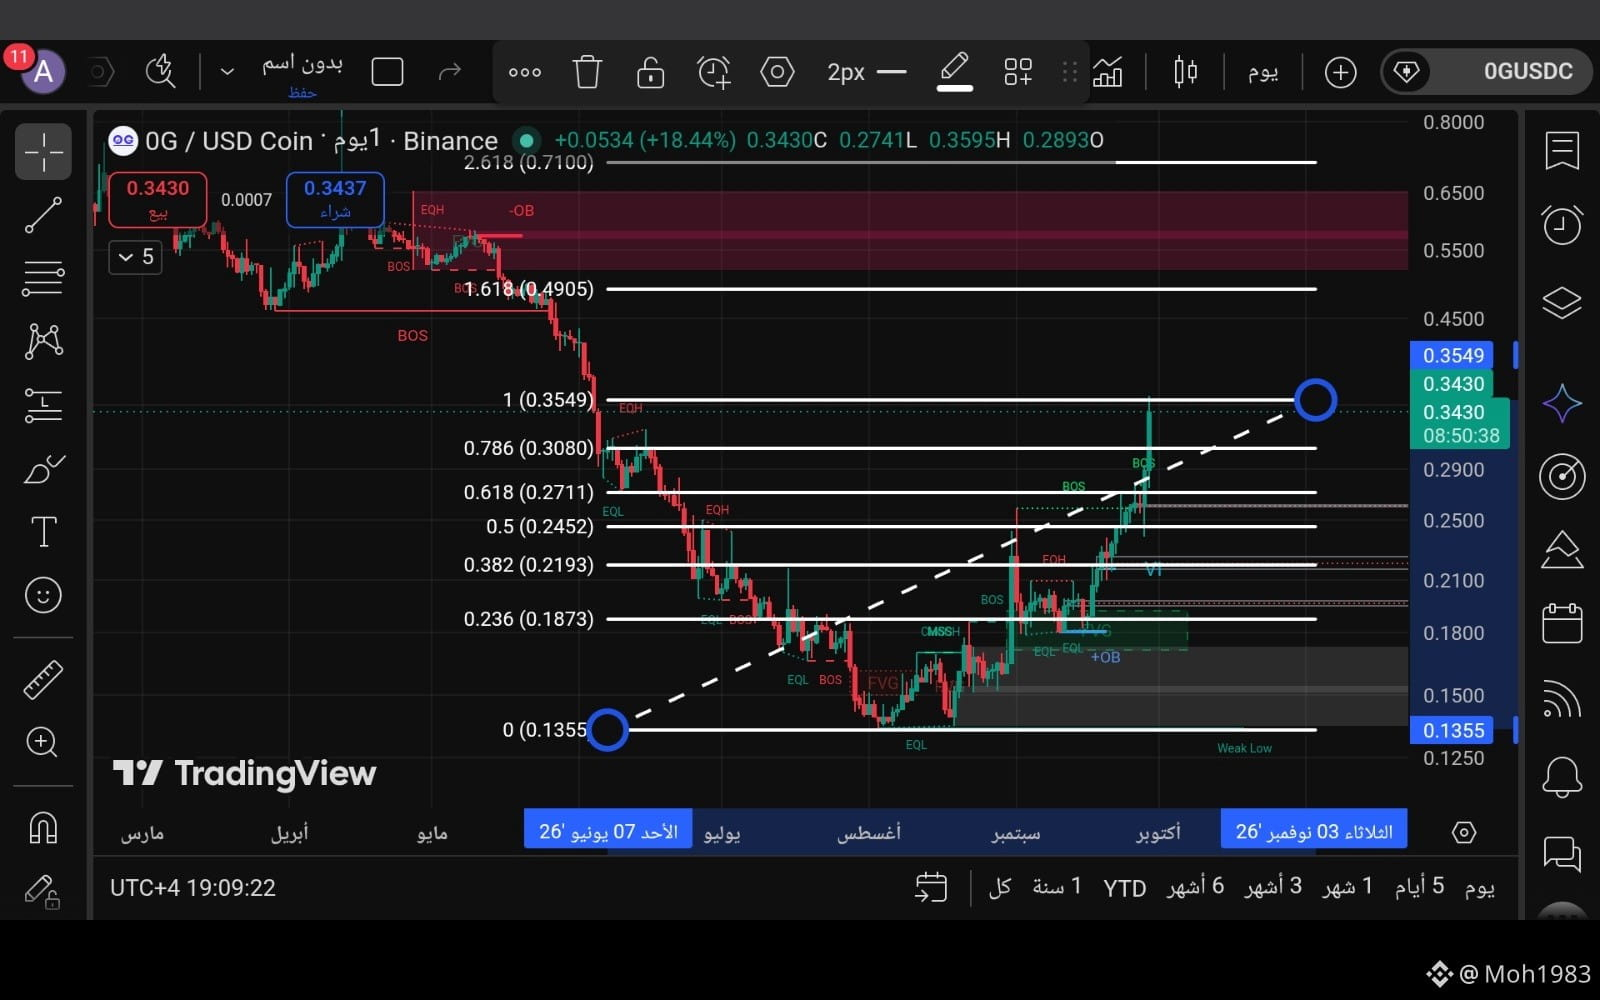
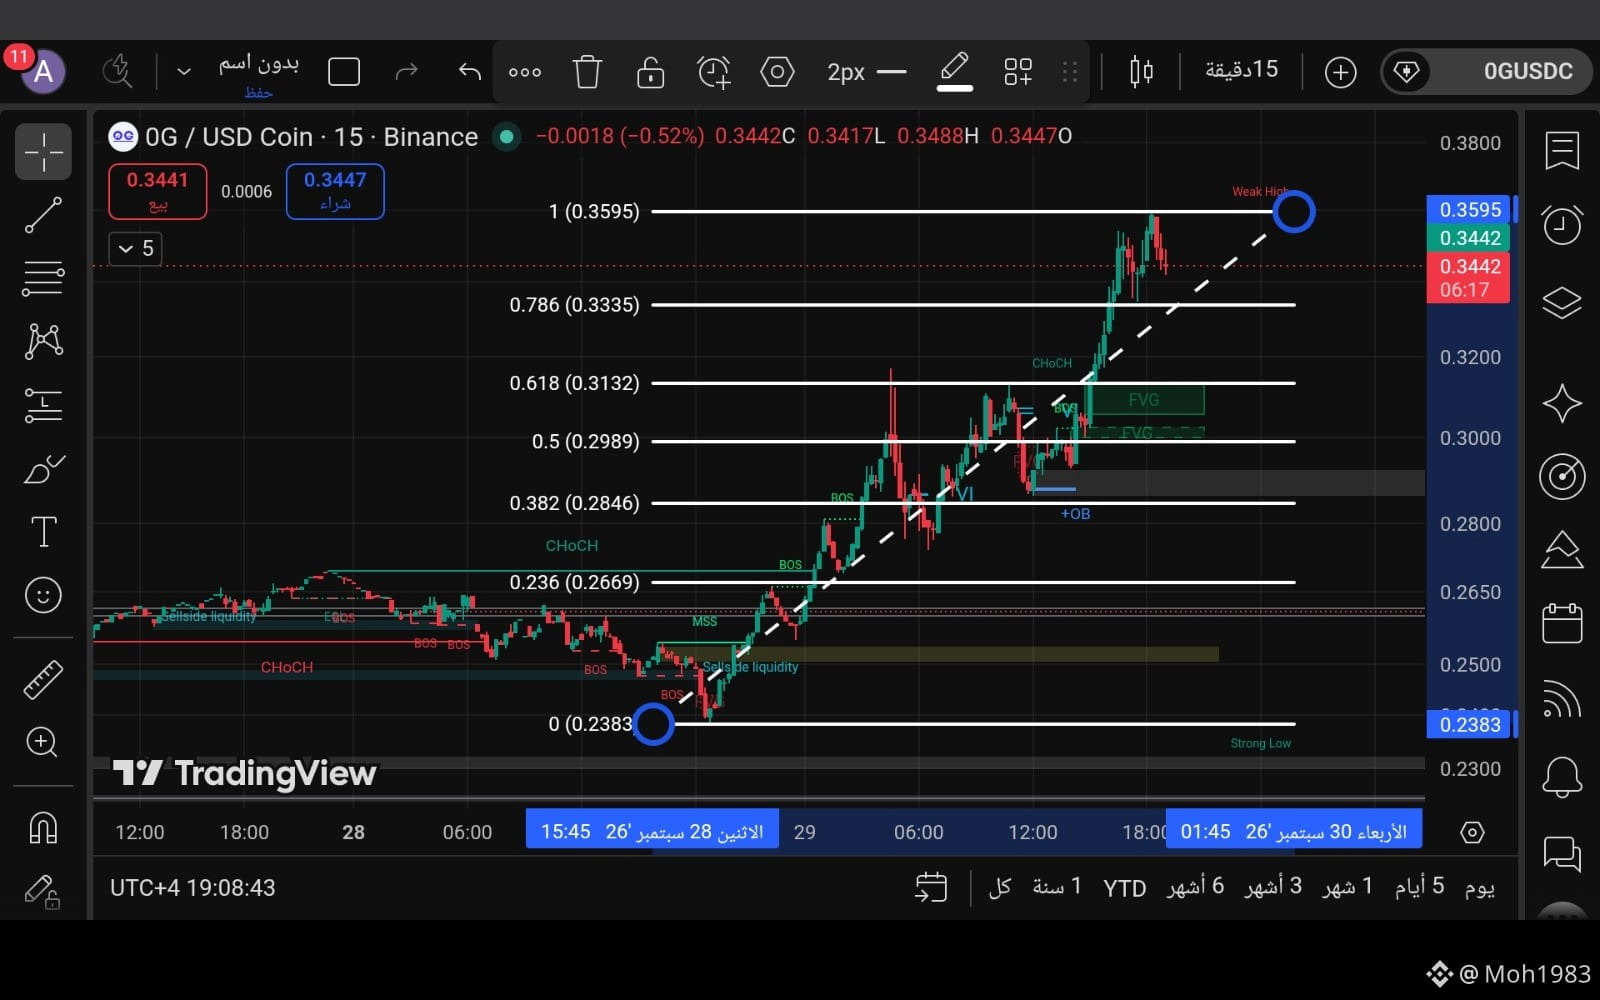
OG coin is in a strong uptrend wave, and the price is currently near 0.344 after breaking important levels and reaching a high of 0.3595. But there is an important factor: the price is currently inside an FVG zone on the weekly timeframe, so we may see volatility or a correction before the move continues.
🔴 Current resistance:
The zone is 0.354–0.360, with the peak at 0.3595. Breaking above it and holding above it supports the continuation of the uptrend.
🟢 Scenario 1 – Continuation of the uptrend:
If the price breaks 0.360 and holds above it: 🎯 0.370
🎯 0.385–0.390
🔻 Scenario 2 – Correction:
If the price fails to break 0.354–0.360 and starts to fall, the most important zones are: 🎯 0.333–0.335
🎯 0.310–0.315
And in case of a deeper correction, the area around 0.280 becomes important; because it represents the previous weekly high zone that was broken, and retesting it as support after the breakout is normal and does not necessarily mean the uptrend has ended.
🛒 Buy zones to watch:
0.330–0.335, then 0.310–0.315, and if there is a strong drop, you can monitor 0.280 for a retest.
⚠️ Important note: The price is currently inside a weekly FVG, so I don’t recommend chasing the move at the top; it’s better to wait for confirmation of the breakout or a clear correction.
📚 This post is for educational purposes to analyze price action, not financial advice
🚨 Technical analysis for $OG | A crucial zone after the strong rise
OG coin is in a strong uptrend wave, and the price is currently near 0.344 after breaking important levels and reaching a high of 0.3595. But there is an important factor: the price is currently inside an FVG zone on the weekly timeframe, so we may see volatility or a correction before the move continues.
🔴 Current resistance:
The zone is 0.354–0.360, with the peak at 0.3595. Breaking above it and holding above it supports the continuation of the uptrend.
🟢 Scenario 1 – Continuation of the uptrend:
If the price breaks 0.360 and holds above it: 🎯 0.370
🎯 0.385–0.390
🔻 Scenario 2 – Correction:
If the price fails to break 0.354–0.360 and starts to fall, the most important zones are: 🎯 0.333–0.335
🎯 0.310–0.315
And in case of a deeper correction, the area around 0.280 becomes important; because it represents the previous weekly high zone that was broken, and retesting it as support after the breakout is normal and does not necessarily mean the uptrend has ended.
🛒 Buy zones to watch:
0.330–0.335, then 0.310–0.315, and if there is a strong drop, you can monitor 0.280 for a retest.
⚠️ Important note: The price is currently inside a weekly FVG, so I don’t recommend chasing the move at the top; it’s better to wait for confirmation of the breakout or a clear correction.
📚 This post is for educational purposes to analyze price action, not financial advice