Technical Analysis ($CRV /USDT - 1D Perpetual)
Market Structure & Reversal:
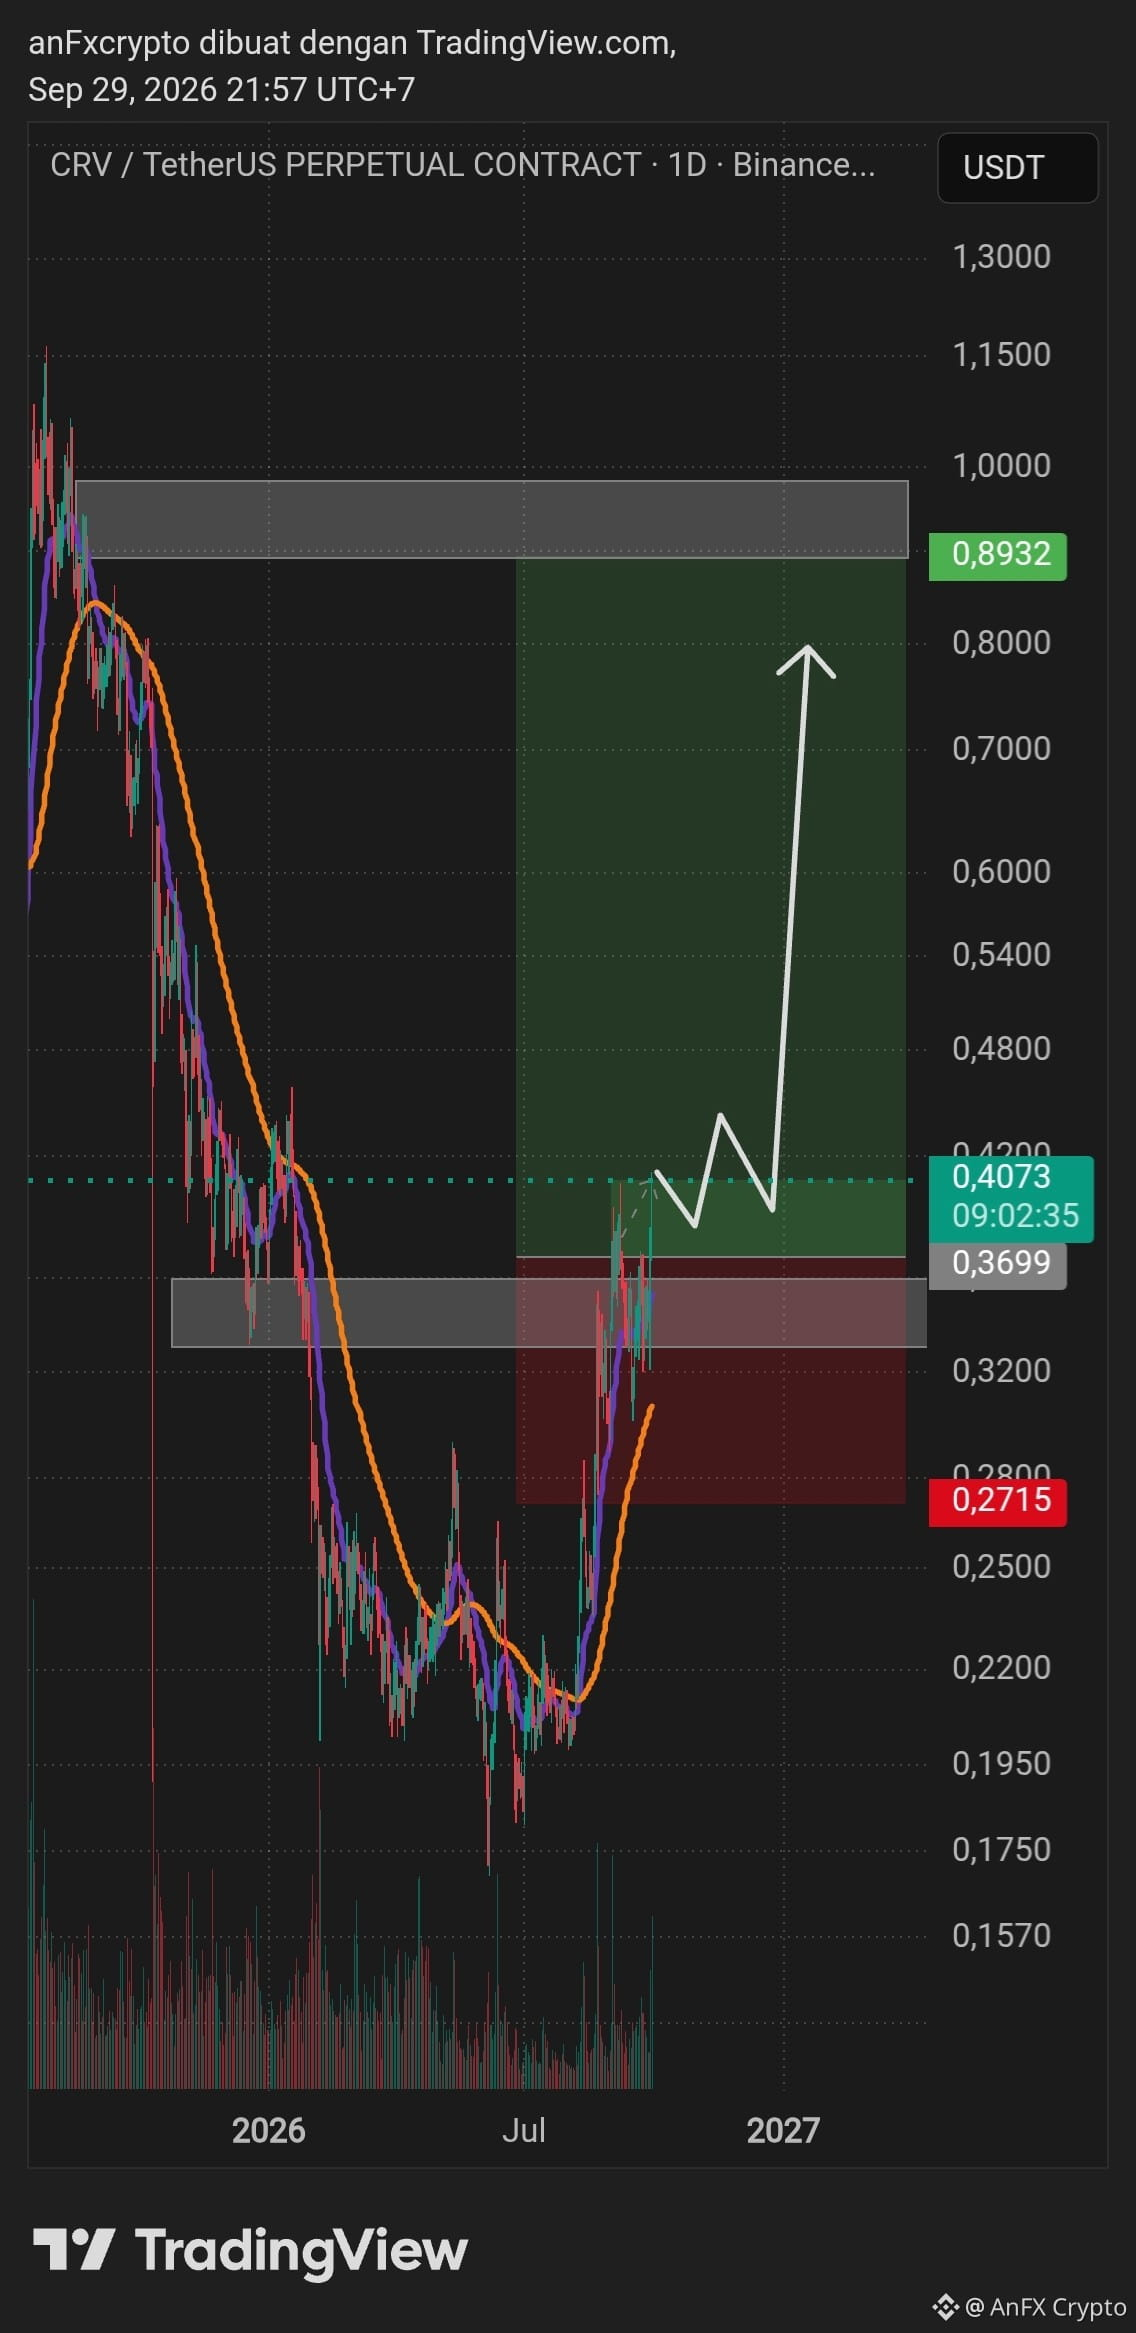
Accumulation Pattern: After experiencing a prolonged downtrend until the lowest point in the range of $0.1750 – $0.1950, CRV forms a base pattern (accumulation / rounded bottom).
Breakout & Potential Retest: Price has broken through the local structure resistance zone in the area of $0.3700. The white line projection indicates the potential for a healthy correction (retest) into the demand zone of $0.3700 – $0.4000 before continuing the main bullish push.
Moving Average Confirmation: The moving average line (EMA) is starting to curve upward and shows bullish crossover indications, supported by a volume surge during the accumulation phase.
Trading Signal (Long Position / Buy Setup)
ParameterLevel Price / DetailsDescriptionAsset PairCRV / TetherUS PerpetualBinance Futures (Timeframe 1D)Position DirectionLONG / BUYTrend-Following Reversal SetupEntry Zone (Buy)$0.3700 – $0.4070Buy the Dip / Retest SupportStop Loss (SL)$0.2715Below the swing low (Invalidation Level)Target Profit 1 (TP 1)$0.5400Local resistance area (Take partial profit)Target Profit 2 (TP 2)$0.7000Mid-range targetTarget Profit 3 (TP 3)$0.8930 – $0.9500Major Resistance Zone (Main Target)Risk-to-Reward Ratio (RRR)1 : 3.84Very ideal for Swing Trading
Risk Calculation & Execution Plan
Risk Projection (SL): A decrease of -$0.1285 per coin (~32.1% of the average entry price $0.4000).
Profit Projection (TP Main): An increase of +$0.4932 per coin (~123.3% of the average entry price $0.4000).
Risk Management Plan:
Position Sizing: Limit maximum loss risk to 1% – 3% of the total trading portfolio equity in this trade.
DCA Entry: Perform staged buying (Dollar-Cost Averaging) within the price range $0.3700 – $0.4070 to obtain the best average entry price.
Profit Protection: Once TP 1 at $0.5400 is hit, immediately move the Stop Loss location to the Entry point (Break Even Point / BEP) to keep the trade position protected from capital loss risk.
Market Structure & Reversal:
Accumulation Pattern: After experiencing a prolonged downtrend until the lowest point in the range of $0.1750 – $0.1950, CRV forms a base pattern (accumulation / rounded bottom).
Breakout & Potential Retest: Price has broken through the local structure resistance zone in the area of $0.3700. The white line projection indicates the potential for a healthy correction (retest) into the demand zone of $0.3700 – $0.4000 before continuing the main bullish push.
Moving Average Confirmation: The moving average line (EMA) is starting to curve upward and shows bullish crossover indications, supported by a volume surge during the accumulation phase.
Trading Signal (Long Position / Buy Setup)
ParameterLevel Price / DetailsDescriptionAsset PairCRV / TetherUS PerpetualBinance Futures (Timeframe 1D)Position DirectionLONG / BUYTrend-Following Reversal SetupEntry Zone (Buy)$0.3700 – $0.4070Buy the Dip / Retest SupportStop Loss (SL)$0.2715Below the swing low (Invalidation Level)Target Profit 1 (TP 1)$0.5400Local resistance area (Take partial profit)Target Profit 2 (TP 2)$0.7000Mid-range targetTarget Profit 3 (TP 3)$0.8930 – $0.9500Major Resistance Zone (Main Target)Risk-to-Reward Ratio (RRR)1 : 3.84Very ideal for Swing Trading
Risk Calculation & Execution Plan
Risk Projection (SL): A decrease of -$0.1285 per coin (~32.1% of the average entry price $0.4000).
Profit Projection (TP Main): An increase of +$0.4932 per coin (~123.3% of the average entry price $0.4000).
Risk Management Plan:
Position Sizing: Limit maximum loss risk to 1% – 3% of the total trading portfolio equity in this trade.
DCA Entry: Perform staged buying (Dollar-Cost Averaging) within the price range $0.3700 – $0.4070 to obtain the best average entry price.
Profit Protection: Once TP 1 at $0.5400 is hit, immediately move the Stop Loss location to the Entry point (Break Even Point / BEP) to keep the trade position protected from capital loss risk.