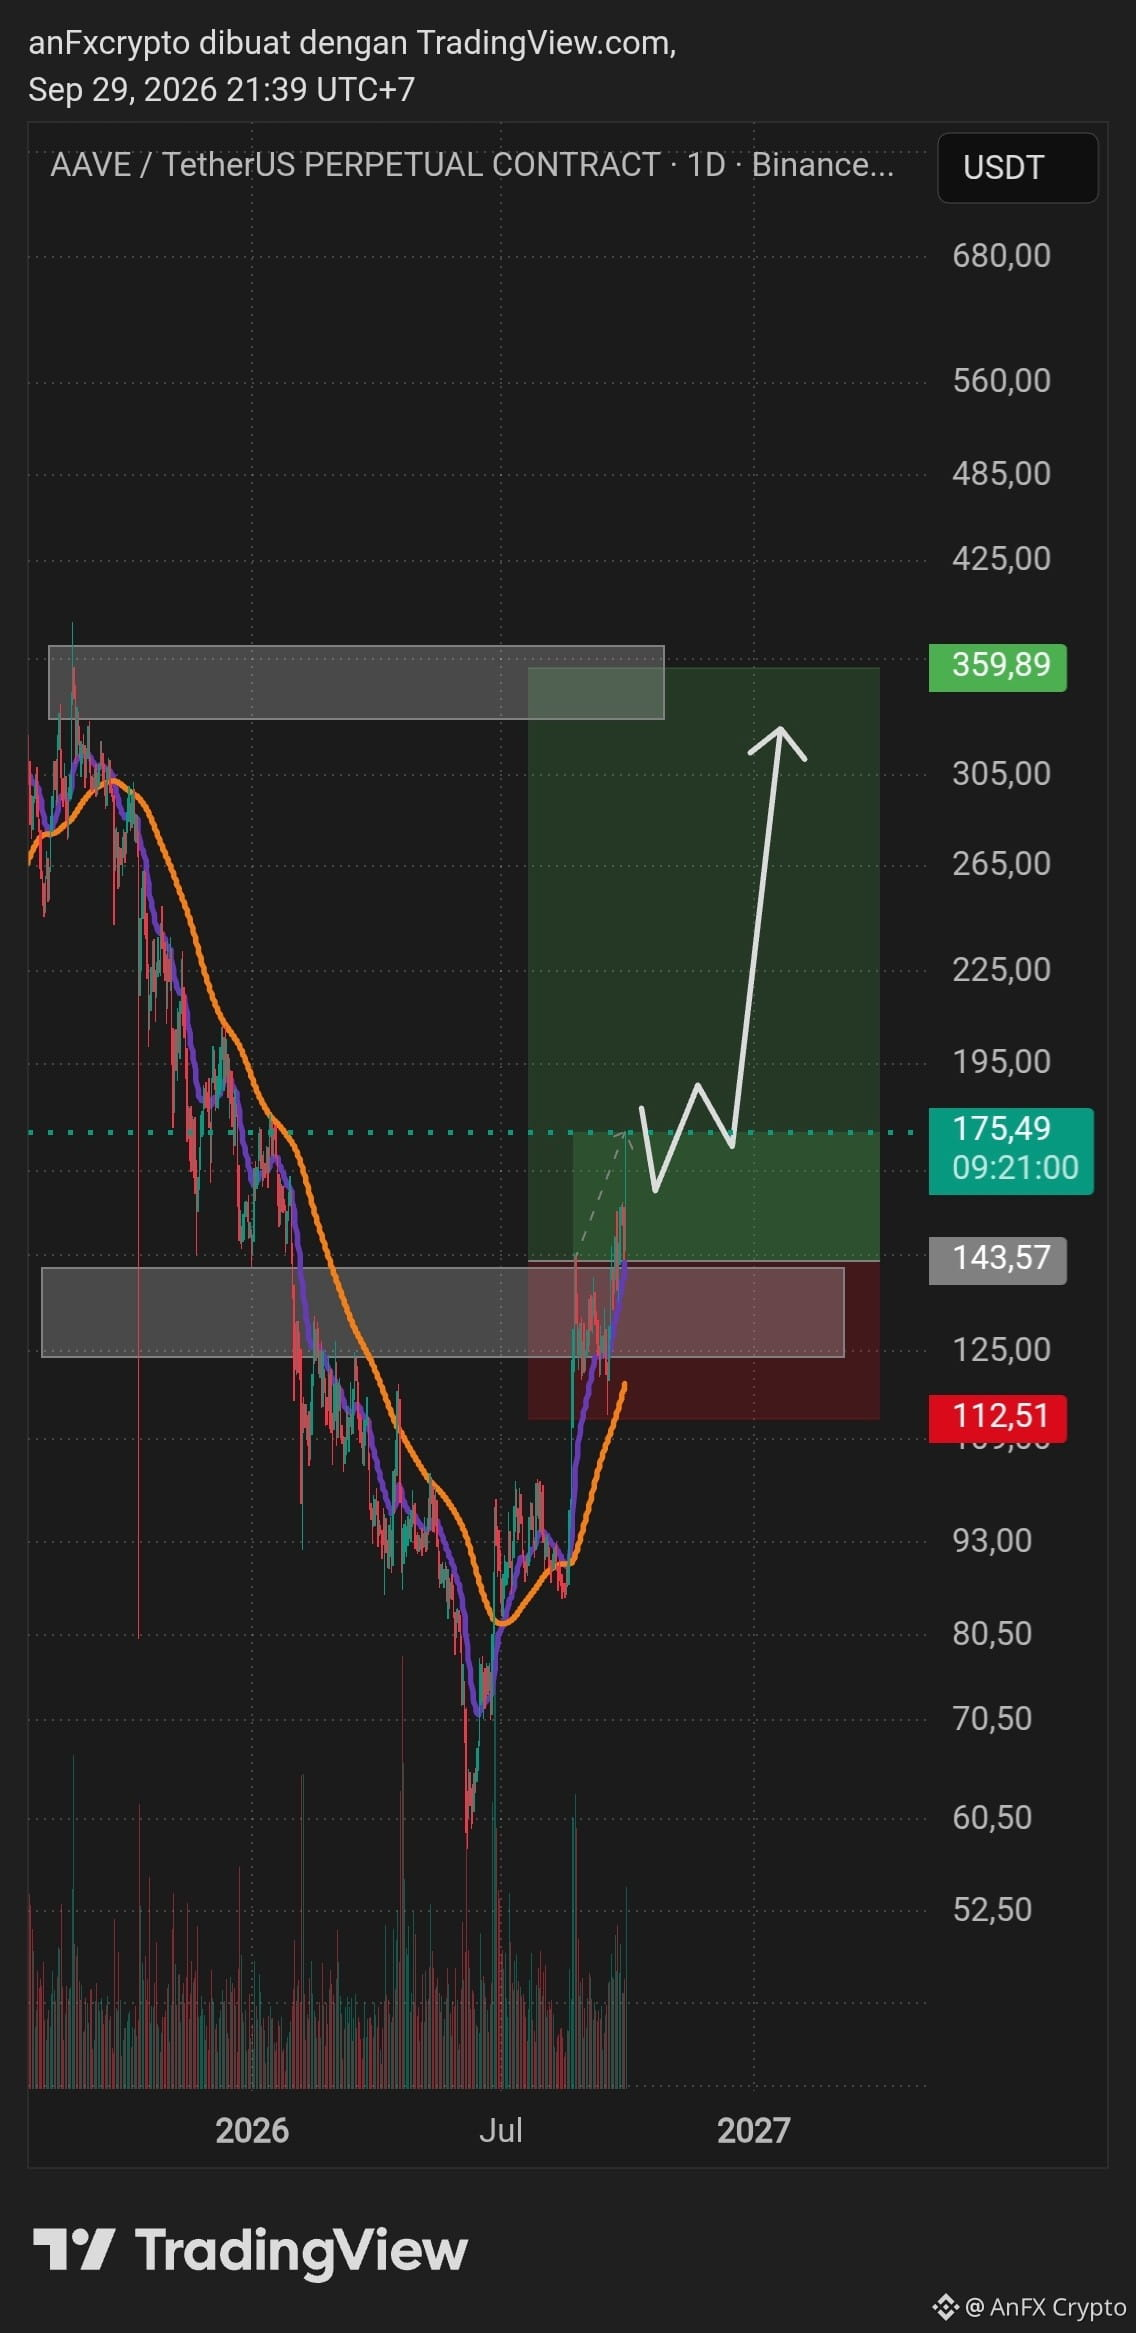
Technical Analysis $AAVE /USDT (1D -)
Market Structure & Price Action:
Trend & Reversal (Reversal): After experiencing a sharp decline and touching the base around $60.50 in July 2026, AAVE has shown a strong bullish impulse push.
Breakout & New Support Zone: Price has broken through an important resistance boundary in the $125.00 – $143.57 area, which is now functioning as a Demand / Support Swap zone.
Movement Projection: The chart indicates a potential healthy correction phase (pullback/retest) back into the demand area before continuing the main bullish expansion toward the Major Supply Zone in the $305.00 – $360.00 range.
Trading Signal (Swing Long Setup)
Bias: Bullish (Buy / Long)
Buy Zone (Entry): $143.50 – $165.00 (Waiting for a correction/retest into the demand area)
Stop Loss (SL): $112.51 (A daily candle close below the demand zone invalidates the bullish structure)
Take Profit (TP): $359.89 (Main target at the upper supply zone)
Risk-to-Reward Ratio (RRR): ~ 1 : 3.8 (Technically very promising)
Execution Plan & Risk Management
Entry Strategy:
Perform Dollar-Cost Averaging (DCA) with staged entries in the $143.50 – $165.00 area. Do not use Full Margin / All-in at the current market price ($175.49) to anticipate a pullback.
Leverage Management & Position Sizing:
Since this is a Swing Trade scenario on the Daily Timeframe (1D), use low leverage (Spot / Futures 2x–5x) to avoid liquidation due to daily volatility.
Limit the maximum loss risk to 1% – 2% of your total portfolio equity on this position.
Stop Loss Adjustment:
If price successfully bounces and breaks through the $200.00 level, move the Stop Loss to Breakeven (BEP / entry price) to secure the main capital.
Market Structure & Price Action:
Trend & Reversal (Reversal): After experiencing a sharp decline and touching the base around $60.50 in July 2026, AAVE has shown a strong bullish impulse push.
Breakout & New Support Zone: Price has broken through an important resistance boundary in the $125.00 – $143.57 area, which is now functioning as a Demand / Support Swap zone.
Movement Projection: The chart indicates a potential healthy correction phase (pullback/retest) back into the demand area before continuing the main bullish expansion toward the Major Supply Zone in the $305.00 – $360.00 range.
Trading Signal (Swing Long Setup)
Bias: Bullish (Buy / Long)
Buy Zone (Entry): $143.50 – $165.00 (Waiting for a correction/retest into the demand area)
Stop Loss (SL): $112.51 (A daily candle close below the demand zone invalidates the bullish structure)
Take Profit (TP): $359.89 (Main target at the upper supply zone)
Risk-to-Reward Ratio (RRR): ~ 1 : 3.8 (Technically very promising)
Execution Plan & Risk Management
Entry Strategy:
Perform Dollar-Cost Averaging (DCA) with staged entries in the $143.50 – $165.00 area. Do not use Full Margin / All-in at the current market price ($175.49) to anticipate a pullback.
Leverage Management & Position Sizing:
Since this is a Swing Trade scenario on the Daily Timeframe (1D), use low leverage (Spot / Futures 2x–5x) to avoid liquidation due to daily volatility.
Limit the maximum loss risk to 1% – 2% of your total portfolio equity on this position.
Stop Loss Adjustment:
If price successfully bounces and breaks through the $200.00 level, move the Stop Loss to Breakeven (BEP / entry price) to secure the main capital.