$84,000 BTC—are you still waiting for $70,000?
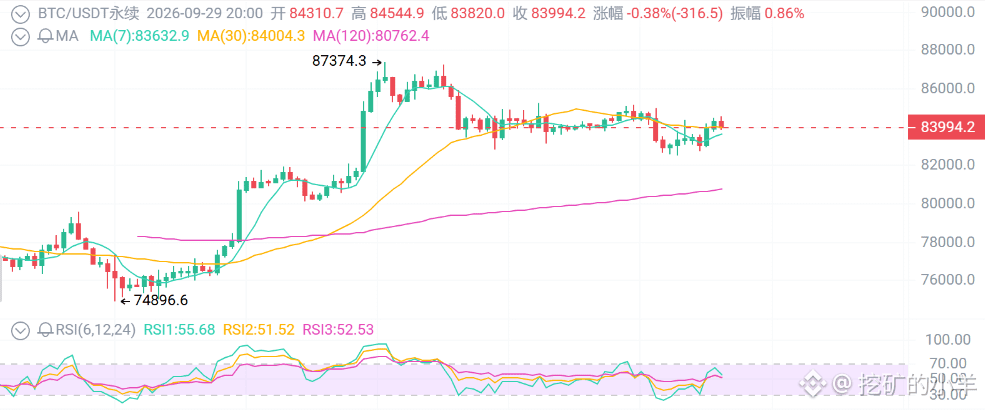
First glance: In 30 days it was lifted from 75,000; over the past 7 days it has fallen into sideways consolidation. On Monday it was smashed to a low of 82,570, and on Tuesday it reclaimed 84,000. You say it’s weak? It’s holding the 82,600 lifeline. You say it’s strong? It hasn’t managed to break above 87,500—three attempts failed. 84,000 is the upper edge of the box. Only after it holds 85,000 can we talk about the second leg. If it breaks below 82,600, treat it as a deep pullback.
First: ETFs are still buying, but the buying momentum is clearly slowing.
For the week of September 25, net inflows were 2.4 billion, the largest weekly inflow since October 2025, and the cumulative total for 2026 has turned positive again. On September 21 alone, it was 999 million in one day.
But look at the recent days: around 135 million on the 25th, and only 31.1 million on the 28th.
Money is still coming in, but the slope has flattened.
Second: On-chain data tells you someone is quietly selling.
The exchange saw a weekly net outflow of 31.8k BTC. Spot liquidity is tightening, and that does provide support. But on the other side: profitability indicators like NUPL have already risen to the highest level since early in the year.
More and more people are making money, and the urge to lock in gains is getting stronger.
Third: There’s no new macro story, but there’s a bomb ticking.
On September 16, the Fed raised rates by 25bp to 3.75%-4.00%; rates are still elevated. The 10-year US Treasury yield remains high, putting pressure on valuations of risk assets.
What to watch next? PCE data.
If the data runs hot, accelerating above 84,000 is basically unlikely—and it could even directly punch through 82,600. If the data comes in soft, that’s your chance to surge with volume toward 85,500.
Key level: 84,000. Only 1,400 dollars away from the life-or-death line at 82,600.
Upward: 84,500-85,000 (recent supply) → 85,500-86,200 (mid-axis) → 87,000-87,400 (impulse top) → only then 90,000+ after 87,500+
Downward: 83,200-83,500 (intraday pullback zone) → 82,600-82,800 (structural lifeline) → 81,000-81,500 (breakout zone from Sep 18) → 78,000
Trading strategies
Aggressive:
Lightly go long near 84,000, stop loss 82,550. First target 85,000, second target 86,200. At 85,000, cut about half.
Conservative:
Wait for 82,800-83,200 before considering longs, stop loss 81,400. An even better entry is near 81,000. If it doesn’t come, hold a small position—don’t rush.
Breakout style:
Only consider chasing if it surges with volume and holds above 85,500, and the pullback doesn’t break 84,500. Target 87,000. If it’s a fake breakout, abandon immediately—no hesitation.
Bears:
If it struggles to push higher from 85,000-85,500, you can lightly short the pullback. Stop loss 86,250, target 82,800. Don’t chop shorts around 82,600—that’s asking to get squeezed.
First glance: In 30 days it was lifted from 75,000; over the past 7 days it has fallen into sideways consolidation. On Monday it was smashed to a low of 82,570, and on Tuesday it reclaimed 84,000. You say it’s weak? It’s holding the 82,600 lifeline. You say it’s strong? It hasn’t managed to break above 87,500—three attempts failed. 84,000 is the upper edge of the box. Only after it holds 85,000 can we talk about the second leg. If it breaks below 82,600, treat it as a deep pullback.
First: ETFs are still buying, but the buying momentum is clearly slowing.
For the week of September 25, net inflows were 2.4 billion, the largest weekly inflow since October 2025, and the cumulative total for 2026 has turned positive again. On September 21 alone, it was 999 million in one day.
But look at the recent days: around 135 million on the 25th, and only 31.1 million on the 28th.
Money is still coming in, but the slope has flattened.
Second: On-chain data tells you someone is quietly selling.
The exchange saw a weekly net outflow of 31.8k BTC. Spot liquidity is tightening, and that does provide support. But on the other side: profitability indicators like NUPL have already risen to the highest level since early in the year.
More and more people are making money, and the urge to lock in gains is getting stronger.
Third: There’s no new macro story, but there’s a bomb ticking.
On September 16, the Fed raised rates by 25bp to 3.75%-4.00%; rates are still elevated. The 10-year US Treasury yield remains high, putting pressure on valuations of risk assets.
What to watch next? PCE data.
If the data runs hot, accelerating above 84,000 is basically unlikely—and it could even directly punch through 82,600. If the data comes in soft, that’s your chance to surge with volume toward 85,500.
Key level: 84,000. Only 1,400 dollars away from the life-or-death line at 82,600.
Upward: 84,500-85,000 (recent supply) → 85,500-86,200 (mid-axis) → 87,000-87,400 (impulse top) → only then 90,000+ after 87,500+
Downward: 83,200-83,500 (intraday pullback zone) → 82,600-82,800 (structural lifeline) → 81,000-81,500 (breakout zone from Sep 18) → 78,000
Trading strategies
Aggressive:
Lightly go long near 84,000, stop loss 82,550. First target 85,000, second target 86,200. At 85,000, cut about half.
Conservative:
Wait for 82,800-83,200 before considering longs, stop loss 81,400. An even better entry is near 81,000. If it doesn’t come, hold a small position—don’t rush.
Breakout style:
Only consider chasing if it surges with volume and holds above 85,500, and the pullback doesn’t break 84,500. Target 87,000. If it’s a fake breakout, abandon immediately—no hesitation.
Bears:
If it struggles to push higher from 85,000-85,500, you can lightly short the pullback. Stop loss 86,250, target 82,800. Don’t chop shorts around 82,600—that’s asking to get squeezed.