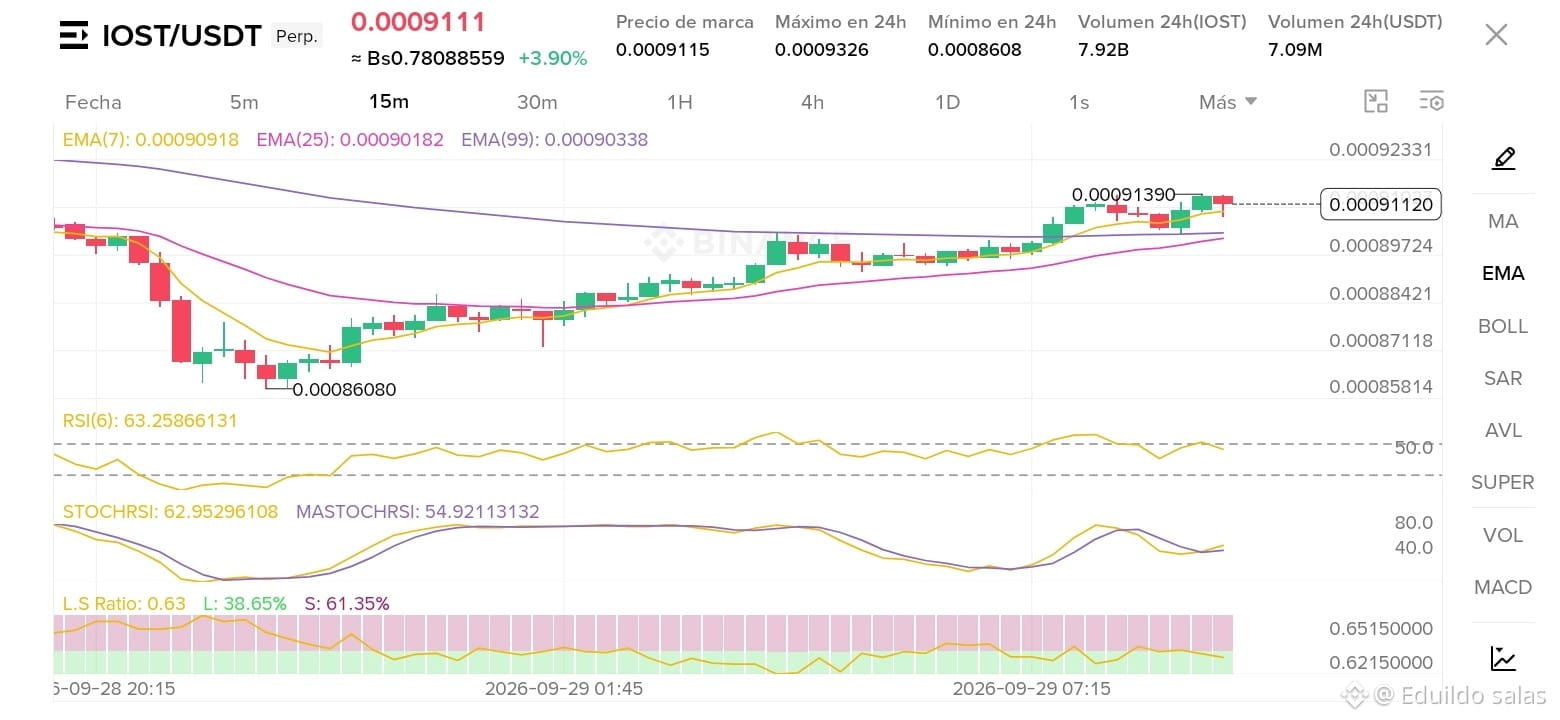
🔥 Technical Analysis of $IOST / USDT (Perpetual) – Timeframe: 15m
The IOST/USDT pair shows a clear intraday recovery after marking a local low in the $0.0008608 area, currently trading around $0.000911 - $0.000912 (+3.90% for the day).
📊 Indicator Readings:
Moving Averages (EMA): The price is trading above the EMA(7) [0.0009091] and the EMA(25) [0.0009018], also surpassing the EMA(99) at 0.0009033, confirming a bullish short-term structure with strong dynamic support.
RSI (6): It sits at 63.25, showing buying strength without yet entering an extreme overbought zone.
StochRSI: It is near 62.95, indicating moderate bullish momentum after the crossover from the lower zone.
Long/Short Ratio: 38.65% Longs vs. 61.35% Shorts, reflecting a clear bearish bias from retail traders, which could trigger a short squeeze if the bulls defend the immediate resistance.
📍 Key Levels to Monitor:
Immediate Resistance: $0.0009139 - $0.0009326 (24h High)
Key Support: $0.0009018 (EMA 25) and $0.0008608 (24h Low)
⚠️ Note: Always remember to manage risk and use a properly adjusted stop loss when trading perpetual contracts. Do you think it will break resistance or will we see a correction? Leave your comments.
#IOST #CryptoAnalysis #BinanceSquare #Trading #CryptoNews
The IOST/USDT pair shows a clear intraday recovery after marking a local low in the $0.0008608 area, currently trading around $0.000911 - $0.000912 (+3.90% for the day).
📊 Indicator Readings:
Moving Averages (EMA): The price is trading above the EMA(7) [0.0009091] and the EMA(25) [0.0009018], also surpassing the EMA(99) at 0.0009033, confirming a bullish short-term structure with strong dynamic support.
RSI (6): It sits at 63.25, showing buying strength without yet entering an extreme overbought zone.
StochRSI: It is near 62.95, indicating moderate bullish momentum after the crossover from the lower zone.
Long/Short Ratio: 38.65% Longs vs. 61.35% Shorts, reflecting a clear bearish bias from retail traders, which could trigger a short squeeze if the bulls defend the immediate resistance.
📍 Key Levels to Monitor:
Immediate Resistance: $0.0009139 - $0.0009326 (24h High)
Key Support: $0.0009018 (EMA 25) and $0.0008608 (24h Low)
⚠️ Note: Always remember to manage risk and use a properly adjusted stop loss when trading perpetual contracts. Do you think it will break resistance or will we see a correction? Leave your comments.
#IOST #CryptoAnalysis #BinanceSquare #Trading #CryptoNews