

灼见Cryptosighted
943 Posts

灼见Cryptosighted
Report
Block User
灼见|K线只是表象,人心才是博弈的终点。
13年实战沉淀,拒绝废话,只做最硬核的技术拆解与宏观透视。帮你看清下一步。如果你厌倦了噪音,这里是你的最后一站。
Open Trade

BTC Holder
Occasional Trader
8.5 Years
624 Following
28.0K+ Followers
9.8K+ Liked
Posts
Portfolio
All
Quotes
Videos
Live
PINNED
🚨 The most interesting moment just happened:
BTC has just finished one of its strongest quarters in nearly two years, yet it pulled back repeatedly at the end of the quarter.
In Q3, it rose by more than 40%, and ETF flows returned on a large scale.
But in the last few days:
📉 BTC has been weakening continuously
💰 ETFs are still flowing in, but the pace has clearly cooled
📈 U.S. Treasury yields continue to suppress risk assets
🔥 Yet market sentiment remains high
This is exactly what’s worth being wary of—and what’s worth looking forward to:
Prices are cooling off, but the market hasn’t fully flipped into panic.
The biggest question now isn’t how much Q3 rose.
It’s—
At the start of Q4, will the profit-taking continue, or will a new round of capital take over again?
If BTC can hold steady after the consecutive pullbacks, the market may quickly start trading the “Q4 play.”
If it can’t, the large profits accumulated in Q3 may turn into fresh selling pressure.
The first battle of October:
🟢 Q4 continues the push / 🔴 Q3 profit-taking
Which side are you on?
#BTC #ETH #BNB
🚨 The most interesting moment just happened:
BTC has just finished one of its strongest quarters in nearly two years, yet it pulled back repeatedly at the end of the quarter.
In Q3, it rose by more than 40%, and ETF flows returned on a large scale.
But in the last few days:
📉 BTC has been weakening continuously
💰 ETFs are still flowing in, but the pace has clearly cooled
📈 U.S. Treasury yields continue to suppress risk assets
🔥 Yet market sentiment remains high
This is exactly what’s worth being wary of—and what’s worth looking forward to:
Prices are cooling off, but the market hasn’t fully flipped into panic.
The biggest question now isn’t how much Q3 rose.
It’s—
At the start of Q4, will the profit-taking continue, or will a new round of capital take over again?
If BTC can hold steady after the consecutive pullbacks, the market may quickly start trading the “Q4 play.”
If it can’t, the large profits accumulated in Q3 may turn into fresh selling pressure.
The first battle of October:
🟢 Q4 continues the push / 🔴 Q3 profit-taking
Which side are you on?
#BTC #ETH #BNB
BTC has just finished one of its strongest quarters in nearly two years, yet it pulled back repeatedly at the end of the quarter.
In Q3, it rose by more than 40%, and ETF flows returned on a large scale.
But in the last few days:
📉 BTC has been weakening continuously
💰 ETFs are still flowing in, but the pace has clearly cooled
📈 U.S. Treasury yields continue to suppress risk assets
🔥 Yet market sentiment remains high
This is exactly what’s worth being wary of—and what’s worth looking forward to:
Prices are cooling off, but the market hasn’t fully flipped into panic.
The biggest question now isn’t how much Q3 rose.
It’s—
At the start of Q4, will the profit-taking continue, or will a new round of capital take over again?
If BTC can hold steady after the consecutive pullbacks, the market may quickly start trading the “Q4 play.”
If it can’t, the large profits accumulated in Q3 may turn into fresh selling pressure.
The first battle of October:
🟢 Q4 continues the push / 🔴 Q3 profit-taking
Which side are you on?
#BTC #ETH #BNB

65
7
319
🎙️ ✨Orange Joyce|Live Stream Start Notification✨
⏰Time: 2026 September 29, 9:00 PM–11:30 PM
📌Topic: Analysis of US stock investment strategies and execution

End
02 h 37 m 12 s
1.3k
11
16
🚨 Anthropic’s IPO filing—possibly the craziest document in the AI industry this year.
Anthropic, the company behind Claude, saw 2025 revenue of about $4.6 billion, up roughly 12-fold.
But what really sets the market on fire is another number:
The IPO valuation could exceed $2 trillion.
Meanwhile:
🚀 Revenue is growing about 12x year over year
💸 Operating losses still exceed $8 billion
🧠 Compute power and infrastructure spending keep skyrocketing
☁️ The scale of future cloud and infrastructure commitments is enormous
🏦 But Wall Street may still hand out a $2 trillion-level valuation
This means the capital markets aren’t really betting on how much Anthropic makes today.
They’re betting on—
Whether AI will ultimately become core infrastructure, just like the internet and electricity.
If Claude and AI Agents truly enter enterprise workflows, a $2 trillion deal could be trading the productivity revolution of the next decade.
But if AI revenue growth can’t keep up with compute costs, this could also become one of the most expensive growth stories in history.
So the real question isn’t:
“Is Anthropic too expensive?”
It’s:
Does AI really deserve to be a new $2 trillion giant?
🟢 AI new era / 🔴 valuation bubble
#BTC #ETH #BNB
🚨 Anthropic’s IPO filing—possibly the craziest document in the AI industry this year.
Anthropic, the company behind Claude, saw 2025 revenue of about $4.6 billion, up roughly 12-fold.
But what really sets the market on fire is another number:
The IPO valuation could exceed $2 trillion.
Meanwhile:
🚀 Revenue is growing about 12x year over year
💸 Operating losses still exceed $8 billion
🧠 Compute power and infrastructure spending keep skyrocketing
☁️ The scale of future cloud and infrastructure commitments is enormous
🏦 But Wall Street may still hand out a $2 trillion-level valuation
This means the capital markets aren’t really betting on how much Anthropic makes today.
They’re betting on—
Whether AI will ultimately become core infrastructure, just like the internet and electricity.
If Claude and AI Agents truly enter enterprise workflows, a $2 trillion deal could be trading the productivity revolution of the next decade.
But if AI revenue growth can’t keep up with compute costs, this could also become one of the most expensive growth stories in history.
So the real question isn’t:
“Is Anthropic too expensive?”
It’s:
Does AI really deserve to be a new $2 trillion giant?
🟢 AI new era / 🔴 valuation bubble
#BTC #ETH #BNB
Anthropic, the company behind Claude, saw 2025 revenue of about $4.6 billion, up roughly 12-fold.
But what really sets the market on fire is another number:
The IPO valuation could exceed $2 trillion.
Meanwhile:
🚀 Revenue is growing about 12x year over year
💸 Operating losses still exceed $8 billion
🧠 Compute power and infrastructure spending keep skyrocketing
☁️ The scale of future cloud and infrastructure commitments is enormous
🏦 But Wall Street may still hand out a $2 trillion-level valuation
This means the capital markets aren’t really betting on how much Anthropic makes today.
They’re betting on—
Whether AI will ultimately become core infrastructure, just like the internet and electricity.
If Claude and AI Agents truly enter enterprise workflows, a $2 trillion deal could be trading the productivity revolution of the next decade.
But if AI revenue growth can’t keep up with compute costs, this could also become one of the most expensive growth stories in history.
So the real question isn’t:
“Is Anthropic too expensive?”
It’s:
Does AI really deserve to be a new $2 trillion giant?
🟢 AI new era / 🔴 valuation bubble
#BTC #ETH #BNB

682
23
60
795

🚨 BTC is seeing a continuous pullback, but there’s one signal that may be more important than price:
Leverage is cooling off fast.
Over the past week, BTC open interest has fallen noticeably, as a large number of highly leveraged positions are being flushed out by the market.
What does that mean?
📉 Price pullback, short-term sentiment cools down
💥 Long leverage continues to get cleared
🧹 Crowded positions begin to shrink
🔄 BTC’s market share dips, while capital is still looking for other opportunities
So this drop can be interpreted in two completely different ways:
🔴 The trend is weakening
🟢 The market is actively deleveraging to clear the way for the next move
The real key isn’t how much BTC drops today.
It’s this—after leverage comes down, will spot buying step back in?
If the price holds and open interest is no longer crazily piling up, this structure could actually be healthier than a “high-leverage blow-off.”
Do you think right now is:
🟢 A healthy shakeout / 🔴 A shift to a weakening trend?
#BTC #ETH #BNB
🚨 BTC is seeing a continuous pullback, but there’s one signal that may be more important than price:
Leverage is cooling off fast.
Over the past week, BTC open interest has fallen noticeably, as a large number of highly leveraged positions are being flushed out by the market.
What does that mean?
📉 Price pullback, short-term sentiment cools down
💥 Long leverage continues to get cleared
🧹 Crowded positions begin to shrink
🔄 BTC’s market share dips, while capital is still looking for other opportunities
So this drop can be interpreted in two completely different ways:
🔴 The trend is weakening
🟢 The market is actively deleveraging to clear the way for the next move
The real key isn’t how much BTC drops today.
It’s this—after leverage comes down, will spot buying step back in?
If the price holds and open interest is no longer crazily piling up, this structure could actually be healthier than a “high-leverage blow-off.”
Do you think right now is:
🟢 A healthy shakeout / 🔴 A shift to a weakening trend?
#BTC #ETH #BNB
Leverage is cooling off fast.
Over the past week, BTC open interest has fallen noticeably, as a large number of highly leveraged positions are being flushed out by the market.
What does that mean?
📉 Price pullback, short-term sentiment cools down
💥 Long leverage continues to get cleared
🧹 Crowded positions begin to shrink
🔄 BTC’s market share dips, while capital is still looking for other opportunities
So this drop can be interpreted in two completely different ways:
🔴 The trend is weakening
🟢 The market is actively deleveraging to clear the way for the next move
The real key isn’t how much BTC drops today.
It’s this—after leverage comes down, will spot buying step back in?
If the price holds and open interest is no longer crazily piling up, this structure could actually be healthier than a “high-leverage blow-off.”
Do you think right now is:
🟢 A healthy shakeout / 🔴 A shift to a weakening trend?
#BTC #ETH #BNB

649
33
53
649
🎙️ Build Binance Square, hold BNB | Tuesday, the market is all red—has the opportunity to bottom-fish arrived? Let's chat~

End
04 h 51 m 58 s
11.2k
47
51

🚨 BTC is showing a very interesting contradiction right now:
Last week, US spot BTC ETFs saw about $2.4 billion in net inflows, setting a new record for the strongest capital week so far this year.
But BTC didn’t continue to accelerate—instead, it has slipped back into consolidation.
Why?
Because the market is simultaneously pricing in two forces that are completely opposite:
💰 ETF money continues to pour in
📈 US Treasury yields are moving higher again
🛢️ Oil prices are rising, and inflation pressure is returning
🔥 Leverage from earlier longs is starting to get flushed out
This means that BTC is no longer as simple as: “capital inflows = price up.”
Institutional demand is propping up the downside, but macro pressure is weighing on the upside.
So what’s really worth watching next is which side breaks first:
Will ETFs keep absorbing more and more, or will high interest rates continue to suppress risk assets?
If BTC can still hold up under this kind of macro environment, then it’s actually worth paying attention.
🟢 Institutional capital wins
🔴 Macro pressure wins
#BTC #ETH #BNB
🚨 BTC is showing a very interesting contradiction right now:
Last week, US spot BTC ETFs saw about $2.4 billion in net inflows, setting a new record for the strongest capital week so far this year.
But BTC didn’t continue to accelerate—instead, it has slipped back into consolidation.
Why?
Because the market is simultaneously pricing in two forces that are completely opposite:
💰 ETF money continues to pour in
📈 US Treasury yields are moving higher again
🛢️ Oil prices are rising, and inflation pressure is returning
🔥 Leverage from earlier longs is starting to get flushed out
This means that BTC is no longer as simple as: “capital inflows = price up.”
Institutional demand is propping up the downside, but macro pressure is weighing on the upside.
So what’s really worth watching next is which side breaks first:
Will ETFs keep absorbing more and more, or will high interest rates continue to suppress risk assets?
If BTC can still hold up under this kind of macro environment, then it’s actually worth paying attention.
🟢 Institutional capital wins
🔴 Macro pressure wins
#BTC #ETH #BNB
Last week, US spot BTC ETFs saw about $2.4 billion in net inflows, setting a new record for the strongest capital week so far this year.
But BTC didn’t continue to accelerate—instead, it has slipped back into consolidation.
Why?
Because the market is simultaneously pricing in two forces that are completely opposite:
💰 ETF money continues to pour in
📈 US Treasury yields are moving higher again
🛢️ Oil prices are rising, and inflation pressure is returning
🔥 Leverage from earlier longs is starting to get flushed out
This means that BTC is no longer as simple as: “capital inflows = price up.”
Institutional demand is propping up the downside, but macro pressure is weighing on the upside.
So what’s really worth watching next is which side breaks first:
Will ETFs keep absorbing more and more, or will high interest rates continue to suppress risk assets?
If BTC can still hold up under this kind of macro environment, then it’s actually worth paying attention.
🟢 Institutional capital wins
🔴 Macro pressure wins
#BTC #ETH #BNB

1.1k
3
41
1.1k
🚨 Bitget hacker begins transferring stolen XRP.
About $83 million worth of XRP has left the original attacker’s wallet address and has been further dispersed.
But what’s really worth paying attention to isn’t the “hacker transfer” itself.
It’s—where do these XRP go next?
🔴 Into exchanges → may create potential sell pressure and platforms can intercept it more easily
🔄 Into cross-chain protocols → tracking and recovery become even more difficult
🟠 Continue splitting into wallets → increases the complexity of tracing the funds
⚠️ XRP itself → Ripple can’t directly freeze XRP the way the issuers of USDT or USDC can
Here’s what must be noted:
On-chain transfer ≠ already sold.
There’s currently no evidence showing that all $83 million worth of XRP has entered the market for liquidation.
So the most important thing going forward isn’t watching whether the wallets “moved,” but watching:
Attacker address → exchange / cross-chain → whether it’s exchanged for other assets.
Only when a large amount of the stolen funds truly enters liquidity outflows might this turn from a “security incident” into more of a “market event.”
What do you think the next step will be:
🔴 Centralized cash-out / 🟠 continue dispersing for money laundering?
#BTC #ETH #BNB
🚨 Bitget hacker begins transferring stolen XRP.
About $83 million worth of XRP has left the original attacker’s wallet address and has been further dispersed.
But what’s really worth paying attention to isn’t the “hacker transfer” itself.
It’s—where do these XRP go next?
🔴 Into exchanges → may create potential sell pressure and platforms can intercept it more easily
🔄 Into cross-chain protocols → tracking and recovery become even more difficult
🟠 Continue splitting into wallets → increases the complexity of tracing the funds
⚠️ XRP itself → Ripple can’t directly freeze XRP the way the issuers of USDT or USDC can
Here’s what must be noted:
On-chain transfer ≠ already sold.
There’s currently no evidence showing that all $83 million worth of XRP has entered the market for liquidation.
So the most important thing going forward isn’t watching whether the wallets “moved,” but watching:
Attacker address → exchange / cross-chain → whether it’s exchanged for other assets.
Only when a large amount of the stolen funds truly enters liquidity outflows might this turn from a “security incident” into more of a “market event.”
What do you think the next step will be:
🔴 Centralized cash-out / 🟠 continue dispersing for money laundering?
#BTC #ETH #BNB
About $83 million worth of XRP has left the original attacker’s wallet address and has been further dispersed.
But what’s really worth paying attention to isn’t the “hacker transfer” itself.
It’s—where do these XRP go next?
🔴 Into exchanges → may create potential sell pressure and platforms can intercept it more easily
🔄 Into cross-chain protocols → tracking and recovery become even more difficult
🟠 Continue splitting into wallets → increases the complexity of tracing the funds
⚠️ XRP itself → Ripple can’t directly freeze XRP the way the issuers of USDT or USDC can
Here’s what must be noted:
On-chain transfer ≠ already sold.
There’s currently no evidence showing that all $83 million worth of XRP has entered the market for liquidation.
So the most important thing going forward isn’t watching whether the wallets “moved,” but watching:
Attacker address → exchange / cross-chain → whether it’s exchanged for other assets.
Only when a large amount of the stolen funds truly enters liquidity outflows might this turn from a “security incident” into more of a “market event.”
What do you think the next step will be:
🔴 Centralized cash-out / 🟠 continue dispersing for money laundering?
#BTC #ETH #BNB

876
16
52
876
🚨 A subtle change that’s easy to overlook is happening:
BTC is still stable, but capital is no longer focused only on BTC.
This quarter, BTC has been strong, and ETH has even more “elasticity.” Over the weekend, the number of rising coins also began to exceed the number of falling ones.
This is usually a signal worth watching when the market enters its next phase:
🟠 BTC keeps the market stable
🔵 ETH starts to amplify its volatility
🟢 More altcoins begin to rotate
💰 Capital shifts from “single-point bets” to looking for opportunities
The real key isn’t how much any one altcoin suddenly pumps.
It’s whether the breadth of the market’s gains can continue to expand.
If BTC holds steady, and ETH, BNB, and more assets keep strengthening, the rotation of capital may not be over yet.
But if BTC breaks down, the high elasticity of altcoins could quickly turn into high volatility.
Who are you backing for the next leg?
🟠 BTC / 🔵 ETH / 🟡 BNB / 🟢 ALTS
#BTC #ETH #BNB
🚨 A subtle change that’s easy to overlook is happening:
BTC is still stable, but capital is no longer focused only on BTC.
This quarter, BTC has been strong, and ETH has even more “elasticity.” Over the weekend, the number of rising coins also began to exceed the number of falling ones.
This is usually a signal worth watching when the market enters its next phase:
🟠 BTC keeps the market stable
🔵 ETH starts to amplify its volatility
🟢 More altcoins begin to rotate
💰 Capital shifts from “single-point bets” to looking for opportunities
The real key isn’t how much any one altcoin suddenly pumps.
It’s whether the breadth of the market’s gains can continue to expand.
If BTC holds steady, and ETH, BNB, and more assets keep strengthening, the rotation of capital may not be over yet.
But if BTC breaks down, the high elasticity of altcoins could quickly turn into high volatility.
Who are you backing for the next leg?
🟠 BTC / 🔵 ETH / 🟡 BNB / 🟢 ALTS
#BTC #ETH #BNB
BTC is still stable, but capital is no longer focused only on BTC.
This quarter, BTC has been strong, and ETH has even more “elasticity.” Over the weekend, the number of rising coins also began to exceed the number of falling ones.
This is usually a signal worth watching when the market enters its next phase:
🟠 BTC keeps the market stable
🔵 ETH starts to amplify its volatility
🟢 More altcoins begin to rotate
💰 Capital shifts from “single-point bets” to looking for opportunities
The real key isn’t how much any one altcoin suddenly pumps.
It’s whether the breadth of the market’s gains can continue to expand.
If BTC holds steady, and ETH, BNB, and more assets keep strengthening, the rotation of capital may not be over yet.
But if BTC breaks down, the high elasticity of altcoins could quickly turn into high volatility.
Who are you backing for the next leg?
🟠 BTC / 🔵 ETH / 🟡 BNB / 🟢 ALTS
#BTC #ETH #BNB

966
38
87
1.8k
·
--
Bullish
Verified
🚨 BNB is quietly strengthening again.
But this time, what’s really worth looking at is not just the price chart.
After BNB Chain recently completed a capacity expansion upgrade, the mainnet’s processing capabilities have continued to improve. In other words, while the price is strengthening, the underlying network is also expanding.
⚡ Network capacity keeps improving
🔥 On-chain activity stays strong
💰 DeFi, trading, and payment demand continues
🤖 New use cases are expanding, such as AI agents and RWA
This creates an interesting logic for BNB:
When BTC enters a period of consolidation, capital may start looking again for assets with real usage and ecosystem support.
What’s truly worth watching isn’t how much BNB is up today, but—
Whether the growth of BNB Chain can continue to translate into value for BNB.
If it can, this won’t be just a simple catch-up rally.
🟢 Ecosystem revaluation
🔴 Short-term rotation
#BTC #ETH #BNB
🚨 BNB is quietly strengthening again.
But this time, what’s really worth looking at is not just the price chart.
After BNB Chain recently completed a capacity expansion upgrade, the mainnet’s processing capabilities have continued to improve. In other words, while the price is strengthening, the underlying network is also expanding.
⚡ Network capacity keeps improving
🔥 On-chain activity stays strong
💰 DeFi, trading, and payment demand continues
🤖 New use cases are expanding, such as AI agents and RWA
This creates an interesting logic for BNB:
When BTC enters a period of consolidation, capital may start looking again for assets with real usage and ecosystem support.
What’s truly worth watching isn’t how much BNB is up today, but—
Whether the growth of BNB Chain can continue to translate into value for BNB.
If it can, this won’t be just a simple catch-up rally.
🟢 Ecosystem revaluation
🔴 Short-term rotation
#BTC #ETH #BNB
But this time, what’s really worth looking at is not just the price chart.
After BNB Chain recently completed a capacity expansion upgrade, the mainnet’s processing capabilities have continued to improve. In other words, while the price is strengthening, the underlying network is also expanding.
⚡ Network capacity keeps improving
🔥 On-chain activity stays strong
💰 DeFi, trading, and payment demand continues
🤖 New use cases are expanding, such as AI agents and RWA
This creates an interesting logic for BNB:
When BTC enters a period of consolidation, capital may start looking again for assets with real usage and ecosystem support.
What’s truly worth watching isn’t how much BNB is up today, but—
Whether the growth of BNB Chain can continue to translate into value for BNB.
If it can, this won’t be just a simple catch-up rally.
🟢 Ecosystem revaluation
🔴 Short-term rotation
#BTC #ETH #BNB

1.1k
27
76
1.1k
🚨 BTC is holding sideways, but the market hasn’t paused with it.
The most notable change over the weekend is that some altcoins have started clearly outperforming BTC.
This usually means capital is repositioning toward directions with higher upside volatility:
🟠 BTC is consolidating at highs, waiting for a direction
🟢 Some altcoins begin accelerating
🔥 Leverage heat has cooled a bit
💰 Money hasn’t clearly left—it’s rotating
Here’s the key question:
If BTC can keep holding steady, there may be room for capital to spread into ETH and altcoins.
But if BTC suddenly breaks down, the so-called “altcoin rotation” is likely to end quickly.
So what’s truly worth watching in this move isn’t “which coin is pumping the fastest,” but rather—
Whether BTC can keep ranging, so that capital feels confident moving outward.
Who do you think is next?
BTC 🟠 / ETH + altcoins 🟢
#BTC #ETH #BNB
🚨 BTC is holding sideways, but the market hasn’t paused with it.
The most notable change over the weekend is that some altcoins have started clearly outperforming BTC.
This usually means capital is repositioning toward directions with higher upside volatility:
🟠 BTC is consolidating at highs, waiting for a direction
🟢 Some altcoins begin accelerating
🔥 Leverage heat has cooled a bit
💰 Money hasn’t clearly left—it’s rotating
Here’s the key question:
If BTC can keep holding steady, there may be room for capital to spread into ETH and altcoins.
But if BTC suddenly breaks down, the so-called “altcoin rotation” is likely to end quickly.
So what’s truly worth watching in this move isn’t “which coin is pumping the fastest,” but rather—
Whether BTC can keep ranging, so that capital feels confident moving outward.
Who do you think is next?
BTC 🟠 / ETH + altcoins 🟢
#BTC #ETH #BNB
The most notable change over the weekend is that some altcoins have started clearly outperforming BTC.
This usually means capital is repositioning toward directions with higher upside volatility:
🟠 BTC is consolidating at highs, waiting for a direction
🟢 Some altcoins begin accelerating
🔥 Leverage heat has cooled a bit
💰 Money hasn’t clearly left—it’s rotating
Here’s the key question:
If BTC can keep holding steady, there may be room for capital to spread into ETH and altcoins.
But if BTC suddenly breaks down, the so-called “altcoin rotation” is likely to end quickly.
So what’s truly worth watching in this move isn’t “which coin is pumping the fastest,” but rather—
Whether BTC can keep ranging, so that capital feels confident moving outward.
Who do you think is next?
BTC 🟠 / ETH + altcoins 🟢
#BTC #ETH #BNB

1.1k
34
93
1.1k
🚨 BTC has an interesting signal:
The ETF just posted its strongest week of the year, yet BTC still hasn’t truly broken out.
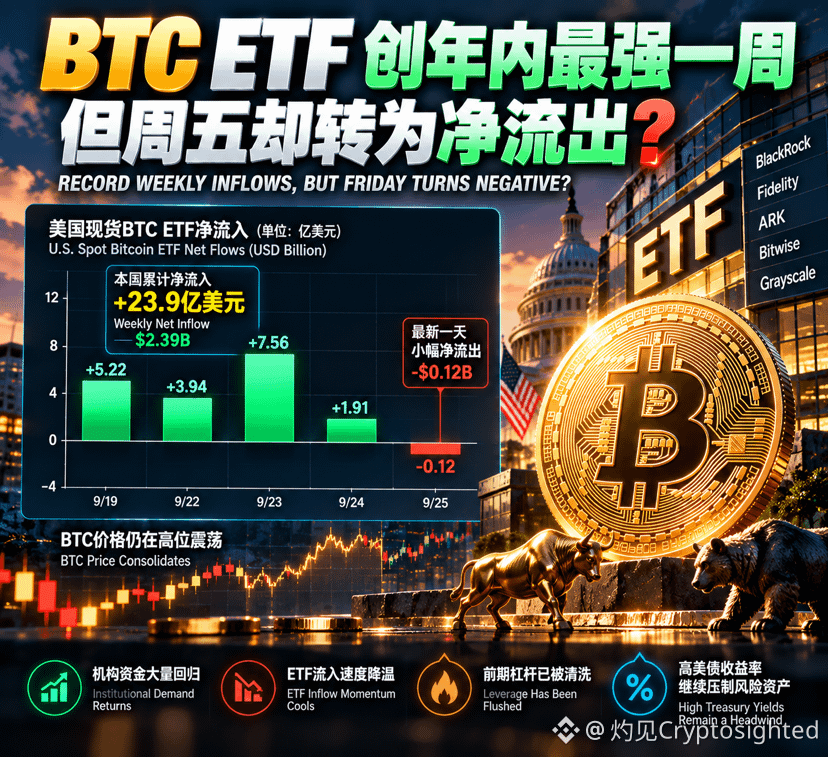
This week, US spot BTC ETFs saw cumulative net inflows of about $2.39 billion. But the money flow is clearly cooling off—on the latest day, it even temporarily turned slightly net outflows.
Meanwhile, BTC is still consolidating at high levels.
This suggests the market is entering a critical phase:
💰 Institutional money is returning in large quantities
📉 The pace of ETF inflows is starting to slow down
🔥 Early leverage has already been flushed out
⚠️ High US Treasury yields continue to suppress risk assets
So the real question right now isn’t “is money coming in or not.”
It’s whether this batch of funds can absorb the sell orders above.
If BTC holds up even after ETF inflows cool down, that actually indicates strong spot absorption.
If inflows keep cooling and the price starts to weaken as well, then the prior breakout needs to be reassessed.
What’s truly worth watching over the weekend is this.
🟢 Building up for a breakout
🔴 Momentum is fading
#BTC #ETH #BNB
🚨 BTC has an interesting signal:
The ETF just posted its strongest week of the year, yet BTC still hasn’t truly broken out.
This week, US spot BTC ETFs saw cumulative net inflows of about $2.39 billion. But the money flow is clearly cooling off—on the latest day, it even temporarily turned slightly net outflows.
Meanwhile, BTC is still consolidating at high levels.
This suggests the market is entering a critical phase:
💰 Institutional money is returning in large quantities
📉 The pace of ETF inflows is starting to slow down
🔥 Early leverage has already been flushed out
⚠️ High US Treasury yields continue to suppress risk assets
So the real question right now isn’t “is money coming in or not.”
It’s whether this batch of funds can absorb the sell orders above.
If BTC holds up even after ETF inflows cool down, that actually indicates strong spot absorption.
If inflows keep cooling and the price starts to weaken as well, then the prior breakout needs to be reassessed.
What’s truly worth watching over the weekend is this.
🟢 Building up for a breakout
🔴 Momentum is fading
#BTC #ETH #BNB
The ETF just posted its strongest week of the year, yet BTC still hasn’t truly broken out.
This week, US spot BTC ETFs saw cumulative net inflows of about $2.39 billion. But the money flow is clearly cooling off—on the latest day, it even temporarily turned slightly net outflows.
Meanwhile, BTC is still consolidating at high levels.
This suggests the market is entering a critical phase:
💰 Institutional money is returning in large quantities
📉 The pace of ETF inflows is starting to slow down
🔥 Early leverage has already been flushed out
⚠️ High US Treasury yields continue to suppress risk assets
So the real question right now isn’t “is money coming in or not.”
It’s whether this batch of funds can absorb the sell orders above.
If BTC holds up even after ETF inflows cool down, that actually indicates strong spot absorption.
If inflows keep cooling and the price starts to weaken as well, then the prior breakout needs to be reassessed.
What’s truly worth watching over the weekend is this.
🟢 Building up for a breakout
🔴 Momentum is fading
#BTC #ETH #BNB
578
1
26
1.5k
🚨 A signal that’s easy to overlook has appeared:
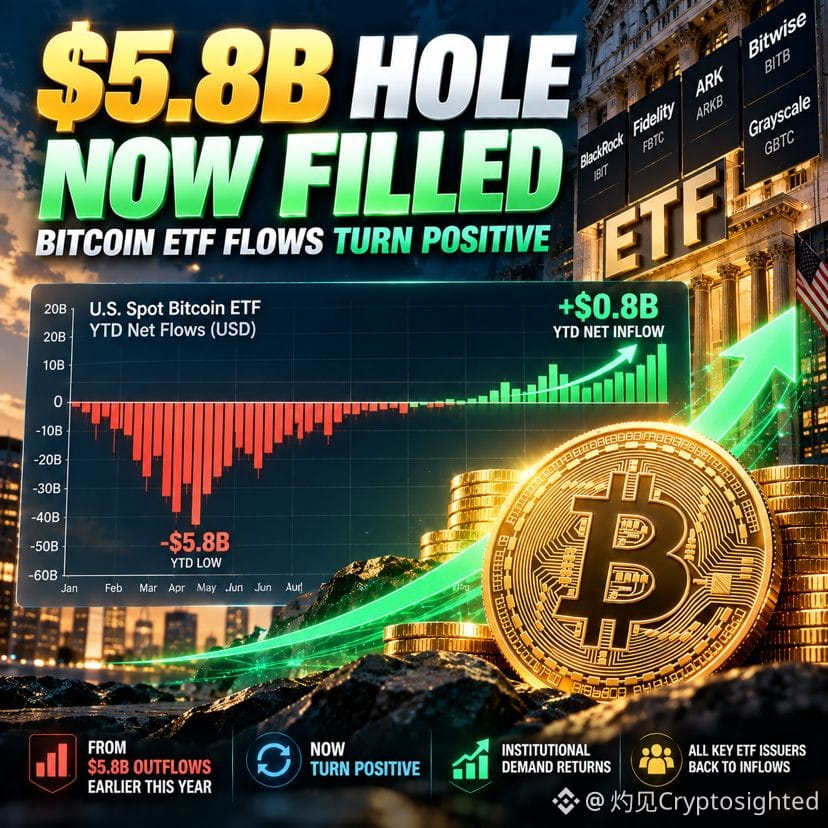
This year, BTC ETF saw cumulative net outflows of about $5.8 billion at one point.
Now, not only has it all been filled back in—year-to-date flows have turned positive again.
But here’s the interesting part:
💰 ETF funds keep coming back
🔥 Leverage is cooling off
📉 But BTC hasn’t broken through immediately
👀 The market is still digesting overhead supply
This suggests it may not be a question of “whether there’s money,” but rather:
Can the newly entering funds absorb the sell orders above?
If ETFs keep attracting capital while BTC gradually raises its lows and highs, this divergence is worth paying attention to.
A real big move often happens when capital changes first, and price confirms later.
Do you think right now it’s:
🟢 A buildup phase
🔴 Even funding can’t rescue the resistance
#BTC #ETH #BNB
🚨 A signal that’s easy to overlook has appeared:
This year, BTC ETF saw cumulative net outflows of about $5.8 billion at one point.
Now, not only has it all been filled back in—year-to-date flows have turned positive again.
But here’s the interesting part:
💰 ETF funds keep coming back
🔥 Leverage is cooling off
📉 But BTC hasn’t broken through immediately
👀 The market is still digesting overhead supply
This suggests it may not be a question of “whether there’s money,” but rather:
Can the newly entering funds absorb the sell orders above?
If ETFs keep attracting capital while BTC gradually raises its lows and highs, this divergence is worth paying attention to.
A real big move often happens when capital changes first, and price confirms later.
Do you think right now it’s:
🟢 A buildup phase
🔴 Even funding can’t rescue the resistance
#BTC #ETH #BNB
This year, BTC ETF saw cumulative net outflows of about $5.8 billion at one point.
Now, not only has it all been filled back in—year-to-date flows have turned positive again.
But here’s the interesting part:
💰 ETF funds keep coming back
🔥 Leverage is cooling off
📉 But BTC hasn’t broken through immediately
👀 The market is still digesting overhead supply
This suggests it may not be a question of “whether there’s money,” but rather:
Can the newly entering funds absorb the sell orders above?
If ETFs keep attracting capital while BTC gradually raises its lows and highs, this divergence is worth paying attention to.
A real big move often happens when capital changes first, and price confirms later.
Do you think right now it’s:
🟢 A buildup phase
🔴 Even funding can’t rescue the resistance
#BTC #ETH #BNB
986
35
90
1.2k
🚨 BTC is in a correction, while ETFs keep attracting inflows for the 6th straight day.
On September 24, US spot Bitcoin ETFs saw net inflows of about $191 million, with BlackRock’s IBIT contributing roughly $163 million.
More importantly, the cumulative net inflows over the past six trading days have already exceeded $2.8 billion.
This creates the most notable divergence in the current market:
📉 BTC pulls back from highs
💰 ETF funds keep flowing in
🔥 Leveraged longs are being liquidated
🏦 But institutional allocation demand hasn’t disappeared in sync
StoneX senior technical strategist Michael Boutros says that behind the recent rise in BTC, there are mainly three categories of buying: ETF inflows, corporate treasury purchases, and short-covering.
The difference is: short-covering will eventually end, while ETF allocation funds theoretically can continue.
However, the $191 million figure also signals something else—ETF inflows are cooling. Previously, daily inflows were close to $1 billion, then gradually declined to $191 million.
So you can’t simply interpret it as “ETF inflows = price will rise immediately.”
What’s truly worth watching is:
Whether ETF funds can continue to hold net inflow, while BTC—after deleveraging—regains spot buying momentum.
If prices adjust but money keeps entering, it looks more like turnover of positions.
Only if ETFs also begin sustaining negative flows might the market logic genuinely change.
The most important question now isn’t whether BTC is up or down today, but:
When prices pull back, who is still buying?
#BTC #ETH #BNB
🚨 BTC is in a correction, while ETFs keep attracting inflows for the 6th straight day.
On September 24, US spot Bitcoin ETFs saw net inflows of about $191 million, with BlackRock’s IBIT contributing roughly $163 million.
More importantly, the cumulative net inflows over the past six trading days have already exceeded $2.8 billion.
This creates the most notable divergence in the current market:
📉 BTC pulls back from highs
💰 ETF funds keep flowing in
🔥 Leveraged longs are being liquidated
🏦 But institutional allocation demand hasn’t disappeared in sync
StoneX senior technical strategist Michael Boutros says that behind the recent rise in BTC, there are mainly three categories of buying: ETF inflows, corporate treasury purchases, and short-covering.
The difference is: short-covering will eventually end, while ETF allocation funds theoretically can continue.
However, the $191 million figure also signals something else—ETF inflows are cooling. Previously, daily inflows were close to $1 billion, then gradually declined to $191 million.
So you can’t simply interpret it as “ETF inflows = price will rise immediately.”
What’s truly worth watching is:
Whether ETF funds can continue to hold net inflow, while BTC—after deleveraging—regains spot buying momentum.
If prices adjust but money keeps entering, it looks more like turnover of positions.
Only if ETFs also begin sustaining negative flows might the market logic genuinely change.
The most important question now isn’t whether BTC is up or down today, but:
When prices pull back, who is still buying?
#BTC #ETH #BNB
On September 24, US spot Bitcoin ETFs saw net inflows of about $191 million, with BlackRock’s IBIT contributing roughly $163 million.
More importantly, the cumulative net inflows over the past six trading days have already exceeded $2.8 billion.
This creates the most notable divergence in the current market:
📉 BTC pulls back from highs
💰 ETF funds keep flowing in
🔥 Leveraged longs are being liquidated
🏦 But institutional allocation demand hasn’t disappeared in sync
StoneX senior technical strategist Michael Boutros says that behind the recent rise in BTC, there are mainly three categories of buying: ETF inflows, corporate treasury purchases, and short-covering.
The difference is: short-covering will eventually end, while ETF allocation funds theoretically can continue.
However, the $191 million figure also signals something else—ETF inflows are cooling. Previously, daily inflows were close to $1 billion, then gradually declined to $191 million.
So you can’t simply interpret it as “ETF inflows = price will rise immediately.”
What’s truly worth watching is:
Whether ETF funds can continue to hold net inflow, while BTC—after deleveraging—regains spot buying momentum.
If prices adjust but money keeps entering, it looks more like turnover of positions.
Only if ETFs also begin sustaining negative flows might the market logic genuinely change.
The most important question now isn’t whether BTC is up or down today, but:
When prices pull back, who is still buying?
#BTC #ETH #BNB

767
8
53
767
Verified
HYPE Listing on Binance: What Really Matters Isn’t “Getting Listed”
Binance officially opens HYPE spot trading. For Hyperliquid, what’s truly important isn’t just that it’s added another trading venue—it’s that HYPE is moving from a native, on-chain asset into the liquidity ecosystem of global mainstream exchanges.
First, user access expands.
Hyperliquid is already a major platform for on-chain perpetual contracts, but many ordinary users don’t use on-chain wallets. By coming to Binance, HYPE can directly reach a much larger base of users on centralized exchanges.
However, more liquidity ≠ prices will definitely rise. According to market microstructure theory, deeper liquidity improves price discovery, but it also makes it easier to buy and sell.
What’s even more worth watching is HYPE’s economic model.
Bitwise CIO Matt Hougan has previously focused on Hyperliquid’s buyback mechanism. The core logic can be summarized as:
Trading volume ↑ → Protocol revenue ↑ → HYPE buybacks ↑ → Demand ↑
Research from Coinbase Institutional also notes that Hyperliquid is expanding from perpetual-contract DEXs to a broader range of trading platforms.
But on the other side, there’s also new supply created by Token Unlocks.
So the real game for HYPE is actually quite simple:
🟢 Protocol revenue → Buybacks → Demand
🔴 Token Unlock → New supply → Selling pressure
Binance listing is simply bringing this supply-demand contest to a bigger market.
Next, there are only three key indicators worth tracking:
Binance’s added liquidity → Hyperliquid’s trading volume and revenue → Whether HYPE buybacks can absorb the新增 supply.
If the added users ultimately convert into real trading volume and revenue, the value of the listing could far exceed short-term market moves.
If there’s only “listing sentiment” but the fundamentals don’t grow in sync, be wary of Sell the News.
So the real question isn’t “How much more can HYPE rise?”—it’s:
Can the liquidity brought by Binance ultimately turn into Hyperliquid’s real cash flow?
#BTC #ETH #BNB
HYPE Listing on Binance: What Really Matters Isn’t “Getting Listed”
Binance officially opens HYPE spot trading. For Hyperliquid, what’s truly important isn’t just that it’s added another trading venue—it’s that HYPE is moving from a native, on-chain asset into the liquidity ecosystem of global mainstream exchanges.
First, user access expands.
Hyperliquid is already a major platform for on-chain perpetual contracts, but many ordinary users don’t use on-chain wallets. By coming to Binance, HYPE can directly reach a much larger base of users on centralized exchanges.
However, more liquidity ≠ prices will definitely rise. According to market microstructure theory, deeper liquidity improves price discovery, but it also makes it easier to buy and sell.
What’s even more worth watching is HYPE’s economic model.
Bitwise CIO Matt Hougan has previously focused on Hyperliquid’s buyback mechanism. The core logic can be summarized as:
Trading volume ↑ → Protocol revenue ↑ → HYPE buybacks ↑ → Demand ↑
Research from Coinbase Institutional also notes that Hyperliquid is expanding from perpetual-contract DEXs to a broader range of trading platforms.
But on the other side, there’s also new supply created by Token Unlocks.
So the real game for HYPE is actually quite simple:
🟢 Protocol revenue → Buybacks → Demand
🔴 Token Unlock → New supply → Selling pressure
Binance listing is simply bringing this supply-demand contest to a bigger market.
Next, there are only three key indicators worth tracking:
Binance’s added liquidity → Hyperliquid’s trading volume and revenue → Whether HYPE buybacks can absorb the新增 supply.
If the added users ultimately convert into real trading volume and revenue, the value of the listing could far exceed short-term market moves.
If there’s only “listing sentiment” but the fundamentals don’t grow in sync, be wary of Sell the News.
So the real question isn’t “How much more can HYPE rise?”—it’s:
Can the liquidity brought by Binance ultimately turn into Hyperliquid’s real cash flow?
#BTC #ETH #BNB
Binance officially opens HYPE spot trading. For Hyperliquid, what’s truly important isn’t just that it’s added another trading venue—it’s that HYPE is moving from a native, on-chain asset into the liquidity ecosystem of global mainstream exchanges.
First, user access expands.
Hyperliquid is already a major platform for on-chain perpetual contracts, but many ordinary users don’t use on-chain wallets. By coming to Binance, HYPE can directly reach a much larger base of users on centralized exchanges.
However, more liquidity ≠ prices will definitely rise. According to market microstructure theory, deeper liquidity improves price discovery, but it also makes it easier to buy and sell.
What’s even more worth watching is HYPE’s economic model.
Bitwise CIO Matt Hougan has previously focused on Hyperliquid’s buyback mechanism. The core logic can be summarized as:
Trading volume ↑ → Protocol revenue ↑ → HYPE buybacks ↑ → Demand ↑
Research from Coinbase Institutional also notes that Hyperliquid is expanding from perpetual-contract DEXs to a broader range of trading platforms.
But on the other side, there’s also new supply created by Token Unlocks.
So the real game for HYPE is actually quite simple:
🟢 Protocol revenue → Buybacks → Demand
🔴 Token Unlock → New supply → Selling pressure
Binance listing is simply bringing this supply-demand contest to a bigger market.
Next, there are only three key indicators worth tracking:
Binance’s added liquidity → Hyperliquid’s trading volume and revenue → Whether HYPE buybacks can absorb the新增 supply.
If the added users ultimately convert into real trading volume and revenue, the value of the listing could far exceed short-term market moves.
If there’s only “listing sentiment” but the fundamentals don’t grow in sync, be wary of Sell the News.
So the real question isn’t “How much more can HYPE rise?”—it’s:
Can the liquidity brought by Binance ultimately turn into Hyperliquid’s real cash flow?
#BTC #ETH #BNB

782
17
69
782
BTC Twice Rejected at $87,300 — What Exactly Is Being Stacked Here?
Bitcoin has recently failed to hold its ground around the $87,300 mark after two separate attempts. At first glance, it looks like a “double top,” but what’s truly worth paying attention to is this: why have sell orders appeared twice in the same area?
On-chain research from Glassnode shows that BTC previously built a relatively dense cost-basis zone between $83,000 and $86,000. When the price returns to higher levels, breakout position holders and profit-takers tend to cluster and sell. So the so-called “resistance” isn’t really a single line—it’s a large number of coin holders making similar choices at roughly the same price.
On the other hand, Min Jung, a researcher at Presto Research, believes that BTC’s recent surge has been driven by a combination of ETF demand, improving risk appetite, and short-covering.
The issue is that a Short Squeeze cannot last indefinitely. Once shorts have been squeezed out more or less, whether the rally can continue depends on whether real spot capital can step in and take the baton.
The most interesting contradiction right now is:
🟢 ETF inflows still present
🔴 Yet BTC has been rejected at $87,300 twice
This suggests the market may not be lacking buyers—rather, sell pressure overhead may be just as strong, and the market is undergoing another round of position rotation.
So, is the “double top” confirmed?
Not yet.
In classic technical analysis, two touches of the same high do not automatically mean a Double Top is formed. The real confirmation requires a subsequent break below the key support between the two peaks—the so-called “neckline.”
If that support holds and BTC challenges $87,300 again, the previous two spike attempts may actually have served to absorb and exhaust sell orders.
So going forward, the only three signals truly worth watching are:
ETF flows → pullback support → spot buying when $87,300 is tested again.
The $87,300 test isn’t about a single number—it’s about this: after short-covering ends, whether real funds can take control of the market.
The third attempt may be the关键 one.
#BTC #ETH #BNB
BTC Twice Rejected at $87,300 — What Exactly Is Being Stacked Here?
Bitcoin has recently failed to hold its ground around the $87,300 mark after two separate attempts. At first glance, it looks like a “double top,” but what’s truly worth paying attention to is this: why have sell orders appeared twice in the same area?
On-chain research from Glassnode shows that BTC previously built a relatively dense cost-basis zone between $83,000 and $86,000. When the price returns to higher levels, breakout position holders and profit-takers tend to cluster and sell. So the so-called “resistance” isn’t really a single line—it’s a large number of coin holders making similar choices at roughly the same price.
On the other hand, Min Jung, a researcher at Presto Research, believes that BTC’s recent surge has been driven by a combination of ETF demand, improving risk appetite, and short-covering.
The issue is that a Short Squeeze cannot last indefinitely. Once shorts have been squeezed out more or less, whether the rally can continue depends on whether real spot capital can step in and take the baton.
The most interesting contradiction right now is:
🟢 ETF inflows still present
🔴 Yet BTC has been rejected at $87,300 twice
This suggests the market may not be lacking buyers—rather, sell pressure overhead may be just as strong, and the market is undergoing another round of position rotation.
So, is the “double top” confirmed?
Not yet.
In classic technical analysis, two touches of the same high do not automatically mean a Double Top is formed. The real confirmation requires a subsequent break below the key support between the two peaks—the so-called “neckline.”
If that support holds and BTC challenges $87,300 again, the previous two spike attempts may actually have served to absorb and exhaust sell orders.
So going forward, the only three signals truly worth watching are:
ETF flows → pullback support → spot buying when $87,300 is tested again.
The $87,300 test isn’t about a single number—it’s about this: after short-covering ends, whether real funds can take control of the market.
The third attempt may be the关键 one.
#BTC #ETH #BNB
Bitcoin has recently failed to hold its ground around the $87,300 mark after two separate attempts. At first glance, it looks like a “double top,” but what’s truly worth paying attention to is this: why have sell orders appeared twice in the same area?
On-chain research from Glassnode shows that BTC previously built a relatively dense cost-basis zone between $83,000 and $86,000. When the price returns to higher levels, breakout position holders and profit-takers tend to cluster and sell. So the so-called “resistance” isn’t really a single line—it’s a large number of coin holders making similar choices at roughly the same price.
On the other hand, Min Jung, a researcher at Presto Research, believes that BTC’s recent surge has been driven by a combination of ETF demand, improving risk appetite, and short-covering.
The issue is that a Short Squeeze cannot last indefinitely. Once shorts have been squeezed out more or less, whether the rally can continue depends on whether real spot capital can step in and take the baton.
The most interesting contradiction right now is:
🟢 ETF inflows still present
🔴 Yet BTC has been rejected at $87,300 twice
This suggests the market may not be lacking buyers—rather, sell pressure overhead may be just as strong, and the market is undergoing another round of position rotation.
So, is the “double top” confirmed?
Not yet.
In classic technical analysis, two touches of the same high do not automatically mean a Double Top is formed. The real confirmation requires a subsequent break below the key support between the two peaks—the so-called “neckline.”
If that support holds and BTC challenges $87,300 again, the previous two spike attempts may actually have served to absorb and exhaust sell orders.
So going forward, the only three signals truly worth watching are:
ETF flows → pullback support → spot buying when $87,300 is tested again.
The $87,300 test isn’t about a single number—it’s about this: after short-covering ends, whether real funds can take control of the market.
The third attempt may be the关键 one.
#BTC #ETH #BNB

482
4
34
1.8k

Article
Bitcoin price is falling, yet money is still flowing in: a “handoff” between leverage and spot is underway in the Bitcoin marketA highly noteworthy phenomenon has appeared in the recent crypto market: as the price of Bitcoin has pulled back from its highs, leveraged long positions have been liquidated, yet U.S. spot Bitcoin ETF inflows have not withdrawn in sync.
At first glance, this seems contradictory. If the market is truly weakening, why are institutional funds still buying? If institutional funds are truly continuing to flow in, why is the price still falling? Understanding this question may be more important than guessing whether the next Bitcoin candlestick will be red or green. Because what the market is likely experiencing now is not simply “rising” or “falling,” but a repricing occurring among spot funds, ETF funds, and leverage in derivatives.
Bitcoin price is falling, yet money is still flowing in: a “handoff” between leverage and spot is underway in the Bitcoin market
A highly noteworthy phenomenon has appeared in the recent crypto market: as the price of Bitcoin has pulled back from its highs, leveraged long positions have been liquidated, yet U.S. spot Bitcoin ETF inflows have not withdrawn in sync.
At first glance, this seems contradictory. If the market is truly weakening, why are institutional funds still buying? If institutional funds are truly continuing to flow in, why is the price still falling? Understanding this question may be more important than guessing whether the next Bitcoin candlestick will be red or green. Because what the market is likely experiencing now is not simply “rising” or “falling,” but a repricing occurring among spot funds, ETF funds, and leverage in derivatives.
At first glance, this seems contradictory. If the market is truly weakening, why are institutional funds still buying? If institutional funds are truly continuing to flow in, why is the price still falling? Understanding this question may be more important than guessing whether the next Bitcoin candlestick will be red or green. Because what the market is likely experiencing now is not simply “rising” or “falling,” but a repricing occurring among spot funds, ETF funds, and leverage in derivatives.
1.7k
20
91
1.7k
🚨 Just a moment ago they were partying, and the market suddenly started to cool down.
$BTC, $ETH, and $BNB all pull back at the same time.
But here’s the interesting part—
the funds haven’t fully left.
The big rally from a few days ago liquidated a large number of shorts, rapidly driving up leverage and sentiment.
Now the market is entering the second phase:
📉 Major coins begin to retrace
💰 ETF funds still haven’t fully shifted to outflows
🔥 Chasing-fomo sentiment from earlier starts to cool
⚡ The market is testing real buy orders again
So the most critical question right now isn’t:
“How much is it down?”
It’s:
Is this just a healthy shakeout after the surge, or is the momentum fading?
If, after the pullback, funds continue to absorb,
it could actually be a normal reshuffling of positions.
But if fund flows, trading volume, and relative strength all weaken at the same time—
then we need to reassess this whole move.
Next, I only look at three things:
ETF funds → leverage → post-pullback absorption.
👇 Which side are you on?
Healthy retracement 🟢 / momentum fading 🔴?
#BTC #ETH #BNB
🚨 Just a moment ago they were partying, and the market suddenly started to cool down.
$BTC, $ETH, and $BNB all pull back at the same time.
But here’s the interesting part—
the funds haven’t fully left.
The big rally from a few days ago liquidated a large number of shorts, rapidly driving up leverage and sentiment.
Now the market is entering the second phase:
📉 Major coins begin to retrace
💰 ETF funds still haven’t fully shifted to outflows
🔥 Chasing-fomo sentiment from earlier starts to cool
⚡ The market is testing real buy orders again
So the most critical question right now isn’t:
“How much is it down?”
It’s:
Is this just a healthy shakeout after the surge, or is the momentum fading?
If, after the pullback, funds continue to absorb,
it could actually be a normal reshuffling of positions.
But if fund flows, trading volume, and relative strength all weaken at the same time—
then we need to reassess this whole move.
Next, I only look at three things:
ETF funds → leverage → post-pullback absorption.
👇 Which side are you on?
Healthy retracement 🟢 / momentum fading 🔴?
#BTC #ETH #BNB
$BTC, $ETH, and $BNB all pull back at the same time.
But here’s the interesting part—
the funds haven’t fully left.
The big rally from a few days ago liquidated a large number of shorts, rapidly driving up leverage and sentiment.
Now the market is entering the second phase:
📉 Major coins begin to retrace
💰 ETF funds still haven’t fully shifted to outflows
🔥 Chasing-fomo sentiment from earlier starts to cool
⚡ The market is testing real buy orders again
So the most critical question right now isn’t:
“How much is it down?”
It’s:
Is this just a healthy shakeout after the surge, or is the momentum fading?
If, after the pullback, funds continue to absorb,
it could actually be a normal reshuffling of positions.
But if fund flows, trading volume, and relative strength all weaken at the same time—
then we need to reassess this whole move.
Next, I only look at three things:
ETF funds → leverage → post-pullback absorption.
👇 Which side are you on?
Healthy retracement 🟢 / momentum fading 🔴?
#BTC #ETH #BNB

815
24
75
815
Log in to explore more content
Join global crypto users on Binance Square
⚡️ Get latest and useful information about crypto.
💬 Trusted by the world’s largest crypto exchange.
👍 Discover real insights from verified creators.
Email / Phone number