Binance Square
悠哉独自在
425 Posts

悠哉独自在

BP-AE61E9D77E8F
Frequent Trader
2.8 Years
74 Following
12.9K+ Followers
2.1K+ Liked
Posts
PINNED
·
--
ZEC fell from 1695 to 1376—was this round a leveraged “big cleanup,” or is the market really over? This ZEC drop has indeed been pretty brutal. From the high at 1695, it got dumped straight down—hitting a low around 1367. Now it’s hovering near 1376, and it’s down nearly 13 points in a single day. Why did it fall this much? Mainly because it had already surged too far beforehand. In the last 30 days it rose 64%, and over 180 days it jumped more than 4x. The profit positions piled up heavily—so once there’s even a little “wind and grass,” it easily triggers a chain-reaction stampede. The daily chart is still holding and hasn’t fully gone bad, but the 4-hour MACD has already formed a dead cross, the green histogram is still expanding, and the 1-hour and 15-minute moving averages are all pressing downward. On the short-term charts, weakness is obvious. On the 4-hour timeframe, open interest (position size) dropped from 219 million to 155 million—leverage funds are withdrawing like crazy. Funding rates even flashed down to -0.05% at one point, and the long/short account ratio fell directly to 0.70. That suggests retail traders on this side are actually疯狂短空 (aggressively going short). Next, let’s look at 1367—this is today’s low, and it’s the short-term line between life and death. If it breaks, chances are it will test 1315. Resistance is at 1483; above that is 1592. Unless price can get back above 1483, any rebounds can only be viewed as weak rebounds. If 1367 can hold up, and the trading volume shrinks and it goes sideways for a few days, then this move is likely a violent washout—washing out the leverage, after which there may still be opportunities. But if it directly breaks through 1367, don’t try to guess the bottom—downside room may open up further. My plan is simple: I’m not rushing to buy. Wait until it stops falling—if it stabilizes and consolidates with reduced volume around 1367 or 1315, then consider trying with a small position. What do you think this ZEC move is—“pulling over cars to pick up people,” or the end of the trend? #zec #zcash $ZEC
ZEC fell from 1695 to 1376—was this round a leveraged “big cleanup,” or is the market really over?

This ZEC drop has indeed been pretty brutal.
From the high at 1695, it got dumped straight down—hitting a low around 1367. Now it’s hovering near 1376, and it’s down nearly 13 points in a single day.

Why did it fall this much?
Mainly because it had already surged too far beforehand. In the last 30 days it rose 64%, and over 180 days it jumped more than 4x. The profit positions piled up heavily—so once there’s even a little “wind and grass,” it easily triggers a chain-reaction stampede.

The daily chart is still holding and hasn’t fully gone bad, but the 4-hour MACD has already formed a dead cross, the green histogram is still expanding, and the 1-hour and 15-minute moving averages are all pressing downward.
On the short-term charts, weakness is obvious.

On the 4-hour timeframe, open interest (position size) dropped from 219 million to 155 million—leverage funds are withdrawing like crazy.
Funding rates even flashed down to -0.05% at one point, and the long/short account ratio fell directly to 0.70.
That suggests retail traders on this side are actually疯狂短空 (aggressively going short).

Next, let’s look at 1367—this is today’s low, and it’s the short-term line between life and death.
If it breaks, chances are it will test 1315.
Resistance is at 1483; above that is 1592.
Unless price can get back above 1483, any rebounds can only be viewed as weak rebounds.

If 1367 can hold up, and the trading volume shrinks and it goes sideways for a few days, then this move is likely a violent washout—washing out the leverage, after which there may still be opportunities.
But if it directly breaks through 1367, don’t try to guess the bottom—downside room may open up further.

My plan is simple:
I’m not rushing to buy.
Wait until it stops falling—if it stabilizes and consolidates with reduced volume around 1367 or 1315, then consider trying with a small position.

What do you think this ZEC move is—“pulling over cars to pick up people,” or the end of the trend?

#zec #zcash $ZEC
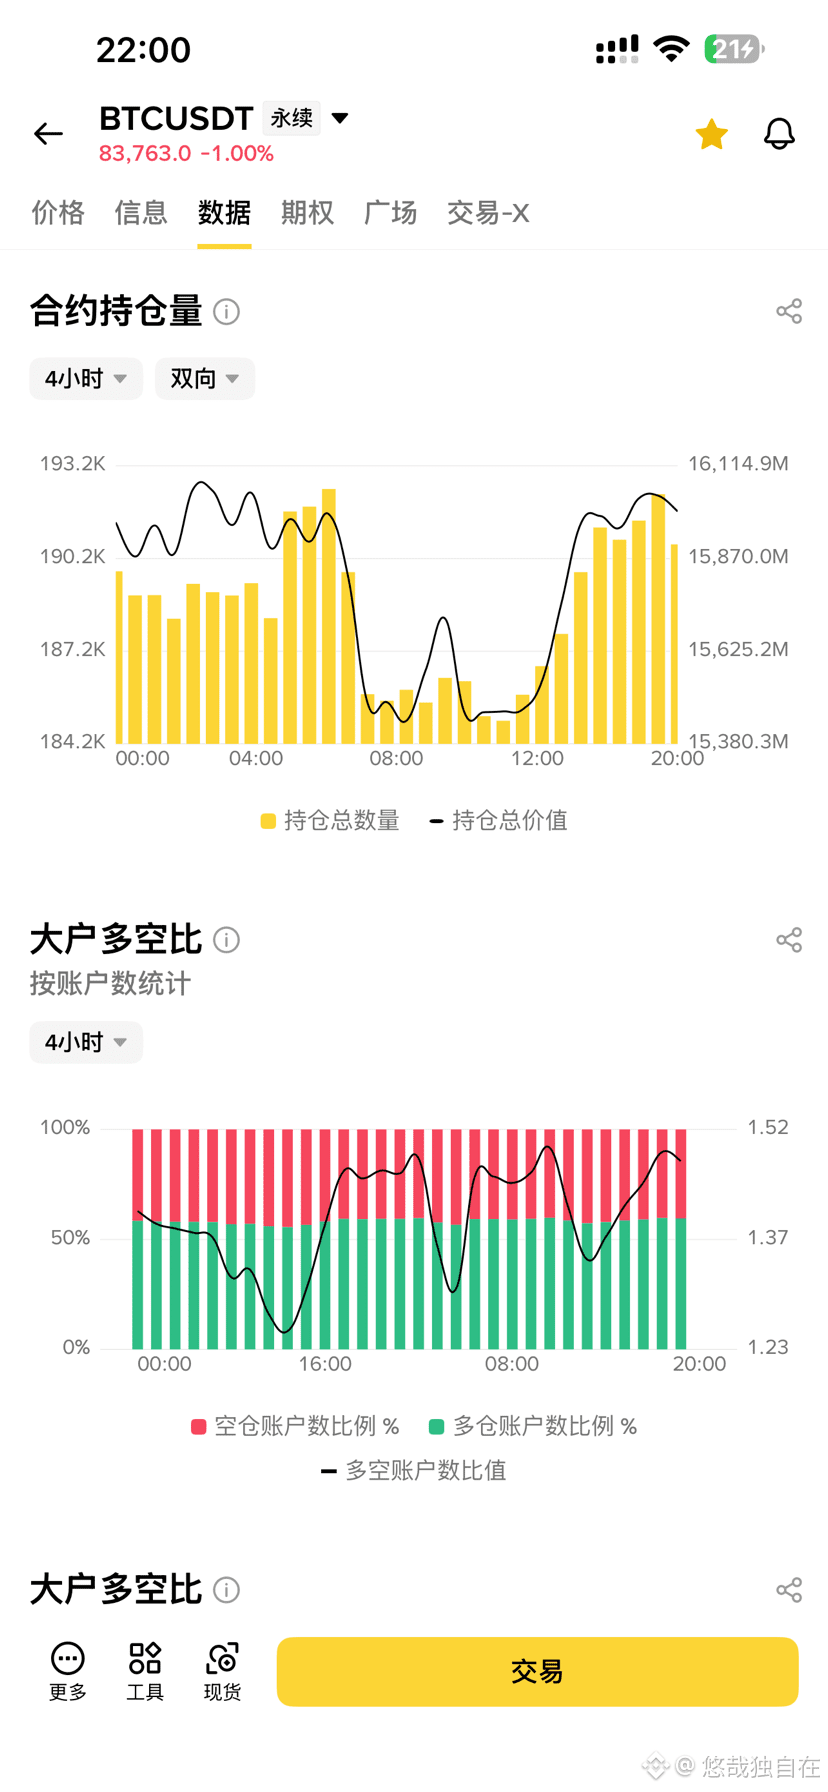
$BTC These days are really boring, constantly scraping back and forth from 83100 to 84600. The volume has also shrunk badly; the trading volume is only 11.6 billion. Both longs and shorts can’t be bothered to move—feels like everyone is waiting for someone else to make the first move. I looked through the contracts: the long/short ratio based on large holders’ positions is 2.1, which is slightly bullish; but if you calculate by number of accounts, it’s only 1.45. This suggests big players have heavy positions but there are fewer of them. Meanwhile, retail traders aren’t as bold. Looking at the funding rate, it’s 0.0046%, basically zero. The contract is even cheaper than the spot, with a negative basis carry showing—sentiment is clearly cautious. As for the candlesticks, not much to say. The daily chart is still standing above MA99, so the big trend hasn’t broken. On the 4-hour chart, the MACD just formed a golden cross; on the 1-hour, it’s dead-crossed and flattening again. The 15-minute chart bounced a bit, but there’s no strength—this is the classic low-volume consolidation pattern. There are only two key levels. On top at 84600—only if it breaks through with increased volume will there be something to watch. Below at 83100—if it breaks, it’ll likely head for 82000. I don’t have a position, and I don’t plan to move right now. Opening trades randomly in this kind of market is basically paying fees to the dog-like market makers; we’ll wait until it chooses a direction on its own. Then we’ll talk once it breaks. Do you have BTC in your hands? Are you holding it, or planning to run? #BTC #美国10年期美债收益率逼近5.3% Pure personal review, not investment advice {future}(BTCUSDT)
$BTC These days are really boring, constantly scraping back and forth from 83100 to 84600.

The volume has also shrunk badly; the trading volume is only 11.6 billion. Both longs and shorts can’t be bothered to move—feels like everyone is waiting for someone else to make the first move.

I looked through the contracts: the long/short ratio based on large holders’ positions is 2.1, which is slightly bullish; but if you calculate by number of accounts, it’s only 1.45. This suggests big players have heavy positions but there are fewer of them. Meanwhile, retail traders aren’t as bold. Looking at the funding rate, it’s 0.0046%, basically zero. The contract is even cheaper than the spot, with a negative basis carry showing—sentiment is clearly cautious.

As for the candlesticks, not much to say. The daily chart is still standing above MA99, so the big trend hasn’t broken. On the 4-hour chart, the MACD just formed a golden cross; on the 1-hour, it’s dead-crossed and flattening again. The 15-minute chart bounced a bit, but there’s no strength—this is the classic low-volume consolidation pattern.

There are only two key levels. On top at 84600—only if it breaks through with increased volume will there be something to watch. Below at 83100—if it breaks, it’ll likely head for 82000.

I don’t have a position, and I don’t plan to move right now. Opening trades randomly in this kind of market is basically paying fees to the dog-like market makers; we’ll wait until it chooses a direction on its own. Then we’ll talk once it breaks.

Do you have BTC in your hands? Are you holding it, or planning to run?

#BTC #美国10年期美债收益率逼近5.3%

Pure personal review, not investment advice
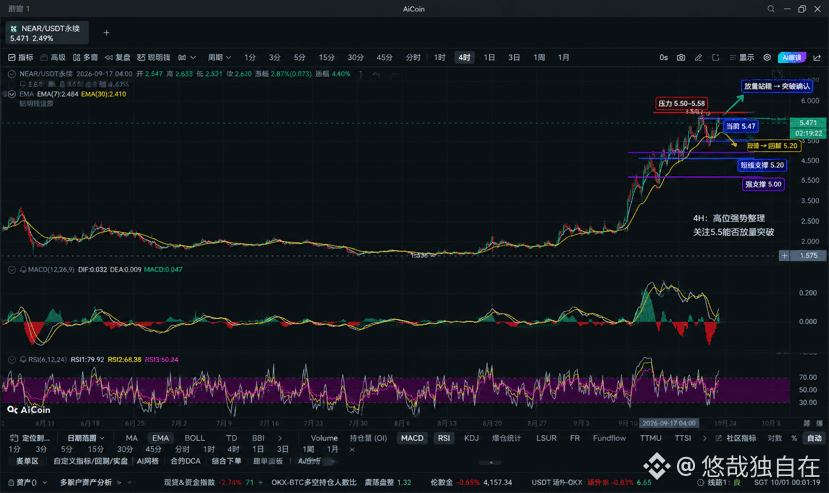
NEAR has jumped almost 3x—can you still chase it? From the bottom, it’s already close to 3x. Today the price is still around 5.4, and within 24 hours it continues to see double-digit gains But the closer the price gets to 5.5, the quieter the chart becomes When it was rallying earlier, the candles kept pushing upward one after another. Now that it’s at this level, it has started to chop and consolidate I looked at the contract data: open interest is falling from its high, and the funding rate hasn’t warmed up noticeably This suggests it’s not mainly being hammered by large short sellers right now. It feels more like the participants who entered earlier are starting to take some profits off the table 5.5 here isn’t really a “top” for now—it’s more like a filter zone If you’re willing to keep chasing, you’ll need to buy through 5.5 to 5.58 If you’re not, you’ll wait for the price to come back to around 5.2, or even 5.0, and then look for a new entry Next, I’ll only watch two things: whether there’s volume above 5.5, and after a breakdown below 5.2 whether there’s enough capital willing to step in If there’s volume above 5.5, it means this leg still has people handing off the baton If it breaks below 5.2, it means the market needs to cool down this round After nearly a 3x run, I think the most important question for NEAR isn’t how much it can rise further, but how many people are still willing to take the next baton from higher levels Do you hold NEAR? Are you planning to chase, or wait for a pullback? #Near $NEAR Personal opinion only—does not constitute investment advice {future}(NEARUSDT)
NEAR has jumped almost 3x—can you still chase it?

From the bottom, it’s already close to 3x. Today the price is still around 5.4, and within 24 hours it continues to see double-digit gains

But the closer the price gets to 5.5, the quieter the chart becomes

When it was rallying earlier, the candles kept pushing upward one after another. Now that it’s at this level, it has started to chop and consolidate

I looked at the contract data: open interest is falling from its high, and the funding rate hasn’t warmed up noticeably

This suggests it’s not mainly being hammered by large short sellers right now. It feels more like the participants who entered earlier are starting to take some profits off the table

5.5 here isn’t really a “top” for now—it’s more like a filter zone

If you’re willing to keep chasing, you’ll need to buy through 5.5 to 5.58

If you’re not, you’ll wait for the price to come back to around 5.2, or even 5.0, and then look for a new entry

Next, I’ll only watch two things: whether there’s volume above 5.5, and after a breakdown below 5.2 whether there’s enough capital willing to step in

If there’s volume above 5.5, it means this leg still has people handing off the baton

If it breaks below 5.2, it means the market needs to cool down this round

After nearly a 3x run, I think the most important question for NEAR isn’t how much it can rise further, but how many people are still willing to take the next baton from higher levels

Do you hold NEAR? Are you planning to chase, or wait for a pullback?

#Near $NEAR

Personal opinion only—does not constitute investment advice
Verified
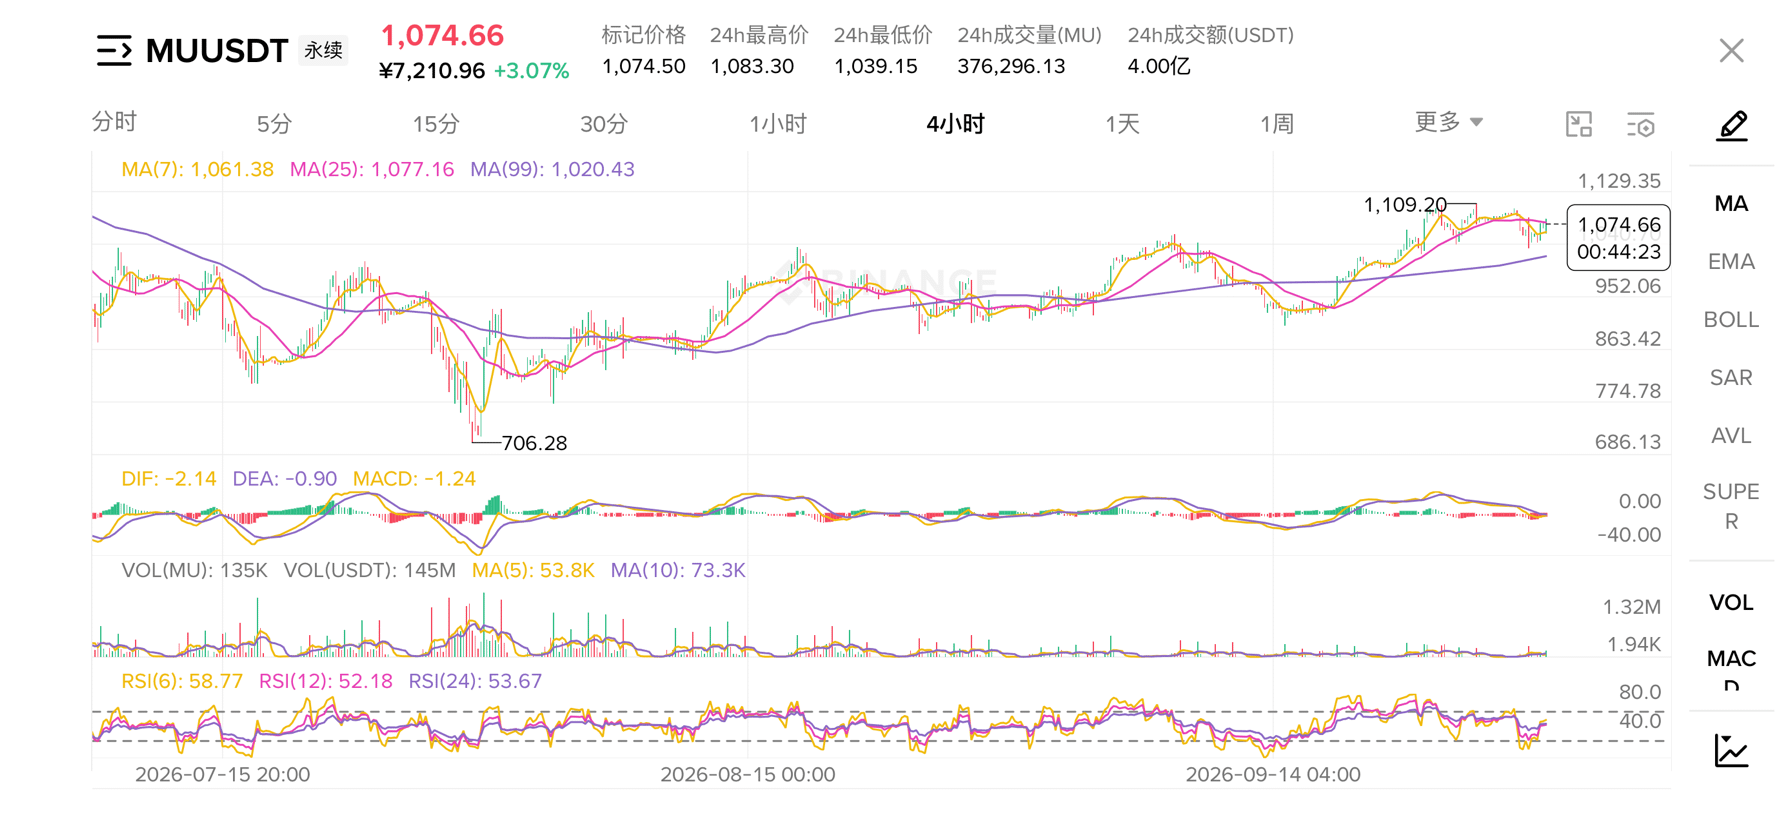
#股票财报季 Before Micron's earnings report, why is the stock price completely unmoved? Is this normal? Micron is set to release its earnings report early tomorrow morning (Beijing time, October 1), but looking at its recent走势, something seems off After dropping from 1257, it has been trading sideways between 1030 and 1100, with a range of less than 7 points and shrinking volume. Normally, before earnings, people either bet on the direction or hedge risk, but the market has been like a dead pool of water Why is this worth noting? Because market expectations for this earnings report are extremely high: revenue is expected to be 51 billion, EPS 31.5, and gross margin could potentially exceed 86%. Under such expectations, the stock price has not reacted in advance, which suggests both bulls and bears are waiting and neither side wants to make the first move On the price structure side, the 4-hour chart is basically a range, with resistance at 1100 and support at 1030. The daily MACD is flat, with no clear direction On the资金 side, there has been no obvious inflow or outflow of large orders, and open interest has remained stable, which means leveraged funds are also waiting on the sidelines The key level is 1050, which is the midpoint of the range and the short-term boundary between bulls and bears. If it holds above 1050, it may test 1100; if it breaks below 1050, it will likely test 1030 If earnings beat expectations but the price rises and then falls back, that is likely a case of good news being fully priced in, with profit-taking selling pressure. If earnings miss expectations and it breaks below 1030 immediately, then support may be found in the 900-950 area. Both directions are possible, so I won't bet on it My view is not to guess whether it will rise or fall, but to watch how the price reacts to key levels after earnings. If it breaks above 1100 with volume and holds there, I will consider it; if it breaks below 1030 and then stabilizes on lower volume, I may also enter with a small position. For now, I am waiting Do any of you hold Micron? Are you planning to bet on earnings, or wait for the result? Personal record, not investment advice$MU {future}(MUUSDT)
#股票财报季 Before Micron's earnings report, why is the stock price completely unmoved? Is this normal?

Micron is set to release its earnings report early tomorrow morning (Beijing time, October 1), but looking at its recent走势, something seems off

After dropping from 1257, it has been trading sideways between 1030 and 1100, with a range of less than 7 points and shrinking volume. Normally, before earnings, people either bet on the direction or hedge risk, but the market has been like a dead pool of water

Why is this worth noting? Because market expectations for this earnings report are extremely high: revenue is expected to be 51 billion, EPS 31.5, and gross margin could potentially exceed 86%. Under such expectations, the stock price has not reacted in advance, which suggests both bulls and bears are waiting and neither side wants to make the first move

On the price structure side, the 4-hour chart is basically a range, with resistance at 1100 and support at 1030. The daily MACD is flat, with no clear direction

On the资金 side, there has been no obvious inflow or outflow of large orders, and open interest has remained stable, which means leveraged funds are also waiting on the sidelines

The key level is 1050, which is the midpoint of the range and the short-term boundary between bulls and bears. If it holds above 1050, it may test 1100; if it breaks below 1050, it will likely test 1030

If earnings beat expectations but the price rises and then falls back, that is likely a case of good news being fully priced in, with profit-taking selling pressure. If earnings miss expectations and it breaks below 1030 immediately, then support may be found in the 900-950 area. Both directions are possible, so I won't bet on it

My view is not to guess whether it will rise or fall, but to watch how the price reacts to key levels after earnings. If it breaks above 1100 with volume and holds there, I will consider it; if it breaks below 1030 and then stabilizes on lower volume, I may also enter with a small position. For now, I am waiting

Do any of you hold Micron? Are you planning to bet on earnings, or wait for the result?

Personal record, not investment advice$MU
·
--
Bullish
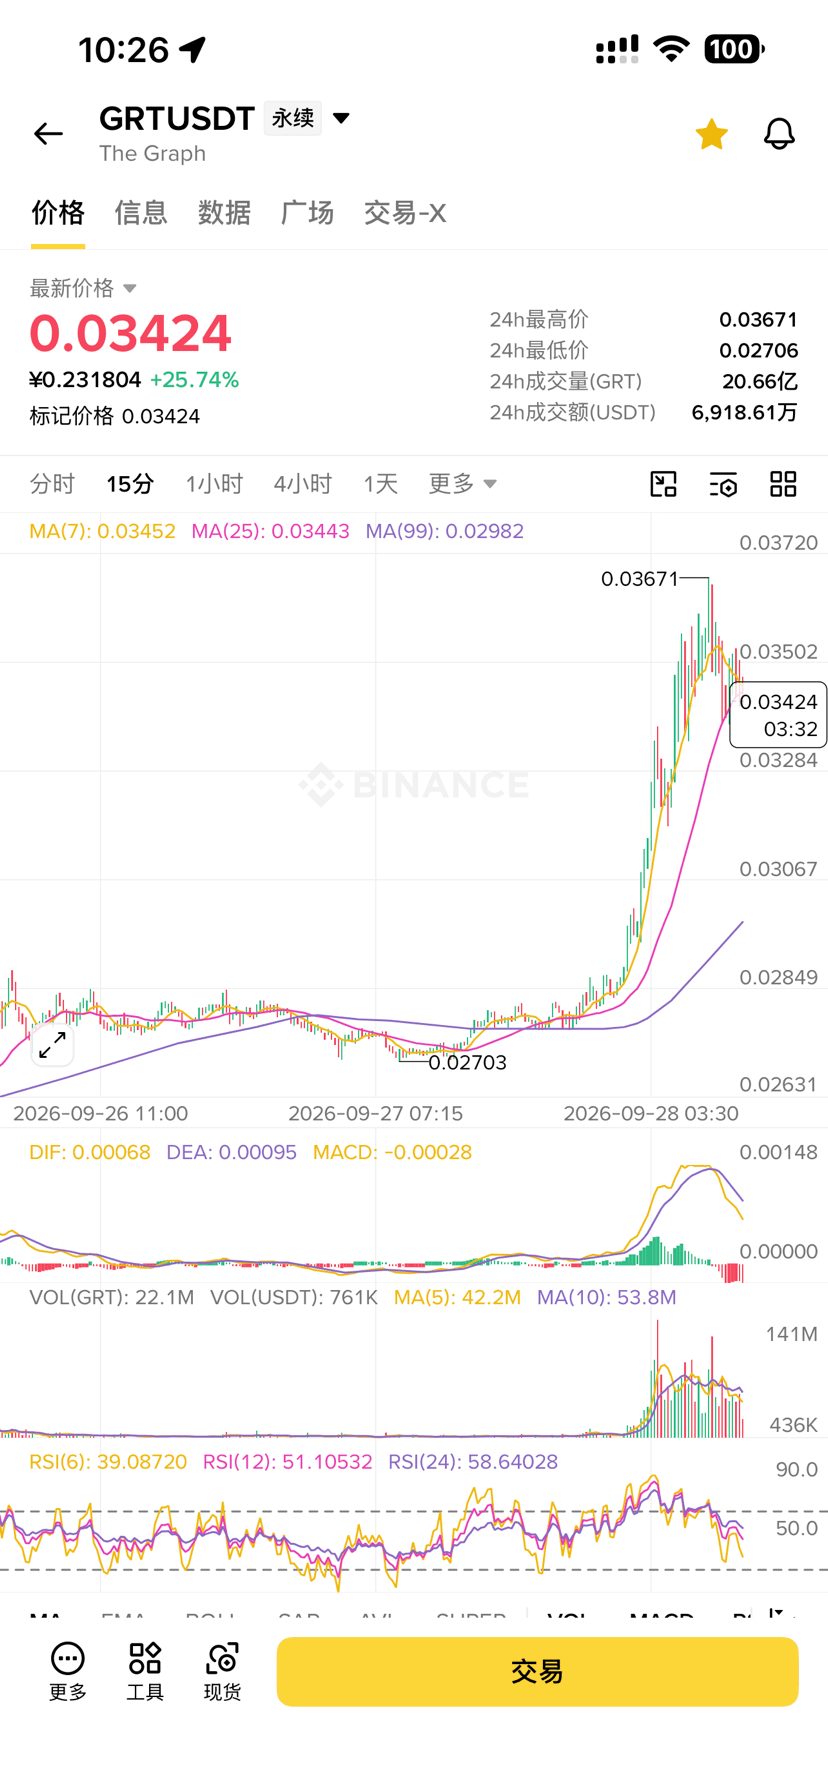
$GRT After breaking through 0.02886, it accelerated directly. It even topped out around 0.03671, and now it’s hovering near 0.0342. In the last 24 hours it’s up 25 points, trading volume is close to 70 million U, and the volume ratio compared to before has clearly expanded. This breakout candle path was pretty straightforward—no hesitation. But when I checked the indicators: on the 15-minute chart, the MACD’s DIF and DEA are starting to converge, and the red histogram is shrinking too. The short-term RSI has already dropped to 39, while the long-term RSI is still around 58—there’s a bit of divergence. The short-term move was too aggressive, and the momentum is weakening. After a breakout of a key level, this kind of acceleration usually leads to two outcomes: either a pullback to 0.02886 to confirm support and then continue higher; or it shoots up and then falls back, leaving the late chasers trapped at the top. Entering at this spot doesn’t offer a great risk-reward ratio. Do you have GRT in your hands? Did you catch this move, or did you miss it? $GRT #GRT {future}(GRTUSDT)
$GRT After breaking through 0.02886, it accelerated directly.

It even topped out around 0.03671, and now it’s hovering near 0.0342. In the last 24 hours it’s up 25 points, trading volume is close to 70 million U, and the volume ratio compared to before has clearly expanded. This breakout candle path was pretty straightforward—no hesitation.

But when I checked the indicators: on the 15-minute chart, the MACD’s DIF and DEA are starting to converge, and the red histogram is shrinking too. The short-term RSI has already dropped to 39, while the long-term RSI is still around 58—there’s a bit of divergence. The short-term move was too aggressive, and the momentum is weakening.

After a breakout of a key level, this kind of acceleration usually leads to two outcomes: either a pullback to 0.02886 to confirm support and then continue higher; or it shoots up and then falls back, leaving the late chasers trapped at the top. Entering at this spot doesn’t offer a great risk-reward ratio.

Do you have GRT in your hands? Did you catch this move, or did you miss it?

$GRT #GRT
$QNT 冲上涨幅榜第一 In the past 24 hours it’s up 73%—from 100 to 195. Now it’s around 173, with trading volume of 900 million (RMB). 4-hour RSI is 98, 1-hour 97, daily 92. Across the whole cycle it’s severely overbought. MACD is in a bullish crossover on every timeframe, the red histogram is still expanding, and momentum is truly strong—but the position is way too high. Now look at the contracts: open interest jumped from 80k straight to 340k—4 times. The big-player long/short ratio dropped from 2.38 to 0.46. Big players are frantically closing longs and even flipping to short, while retail investors are still mindlessly buying and going long. The funding rate is -0.0164%—shorts are paying. This structure is exactly the same as those previous bull-pump rallies by older coins: the main force pushes the price up to distribute, and retail gets stuck holding the bag. With this kind of vertical rally, the risk/reward is too poor if you chase it. Wait for it to pull back into the 130–140 range; once volume contracts and it stabilizes, then we can talk. Do you have QNT? Did you catch the move this time, or are you watching from the sidelines? $QNT #QNT {future}(QNTUSDT)
$QNT 冲上涨幅榜第一

In the past 24 hours it’s up 73%—from 100 to 195. Now it’s around 173, with trading volume of 900 million (RMB).

4-hour RSI is 98, 1-hour 97, daily 92. Across the whole cycle it’s severely overbought. MACD is in a bullish crossover on every timeframe, the red histogram is still expanding, and momentum is truly strong—but the position is way too high.

Now look at the contracts: open interest jumped from 80k straight to 340k—4 times.

The big-player long/short ratio dropped from 2.38 to 0.46. Big players are frantically closing longs and even flipping to short, while retail investors are still mindlessly buying and going long.

The funding rate is -0.0164%—shorts are paying. This structure is exactly the same as those previous bull-pump rallies by older coins: the main force pushes the price up to distribute, and retail gets stuck holding the bag.

With this kind of vertical rally, the risk/reward is too poor if you chase it. Wait for it to pull back into the 130–140 range; once volume contracts and it stabilizes, then we can talk.

Do you have QNT? Did you catch the move this time, or are you watching from the sidelines?

$QNT #QNT
#Circle在Solana增发5亿枚USDC Saw Circle increase 500 million USDC on Solana—first reaction: are they firing bullets again? But issuing more doesn’t necessarily mean buying the coin right away; in many cases it’s just stockpiling to meet demand. Solana’s on-chain activity has been decent lately, and there truly is steadycoin demand—whether this is a real positive catalyst depends on where these USDC end up next: exchanges or DeFi pools. I’m not in a rush to chase the bullish news—what do you think? #USDC #solana
#Circle在Solana增发5亿枚USDC Saw Circle increase 500 million USDC on Solana—first reaction: are they firing bullets again?

But issuing more doesn’t necessarily mean buying the coin right away; in many cases it’s just stockpiling to meet demand.

Solana’s on-chain activity has been decent lately, and there truly is steadycoin demand—whether this is a real positive catalyst depends on where these USDC end up next: exchanges or DeFi pools.

I’m not in a rush to chase the bullish news—what do you think?
#USDC #solana
自由1688
·
--
Google Employee Quits Over Worries About Superintelligent AI: Pursuing Powerful AI Is Irresponsible—Can’t Turn a Blind Eye

According to a report by Business Insider, a Google employee said he has resigned from the company, arguing that pursuing more powerful AI is “inherently irresponsible.” Robert O’Callahan, who previously worked at Google DeepMind, posted on X that his team is developing chips to make AI run faster and at lower cost, and that he believes AI has “progressed too fast.”

He shared a resignation letter on his personal blog and said he sent it to colleagues on Friday. In the letter, he wrote that he couldn’t “turn a blind eye” to the impact of his work, because doing so “is not something a person who follows Jesus should do.” In his blog bio, he describes himself as a Christian.

“This is not an easy decision. I like my coworkers and I like the work environment here, and being paid a generous salary to solve interesting problems has always been a great thing,” he wrote. “But our team’s ultimate goal is to reduce the cost of AI dramatically and significantly lower latency, and I don’t think that is good for the people currently living: I strongly believe the speed of AI progress is simply too fast (and I also have doubts about where it will ultimately lead).”

兰汐kyL
·
--
$ZEC $SOL Goldman Sachs’ latest outlook is here: the Fed will most likely raise rates again in October. After that, this hiking cycle could possibly be nearing its end, while rate cuts may not come until the end of 2027. Many crypto friends, upon seeing this news, start thinking about how the overall market might move.🚨

The key point is oil prices. Goldman Sachs says that only if oil prices keep falling and suppress inflation will this rate-hike expectation materialize. If oil prices continue to surge and inflation doesn’t come down, the Fed’s rate-hike pace will keep adjusting, and the crypto market will definitely wobble along with it.🚨

We all know that crypto market performance is highly tied to USD liquidity. If the last rate hike in October is carried out as expected—making the bad news “already priced in”—the market could see a rebound in the short term. But don’t get carried away: rate cuts are still a long way off, and large funds won’t immediately rush in at scale, making it difficult to directly turn into a full-fledged bull market.🚨

Right now, the market is likely going to be a tug-of-war—up a few days and then prone to pullbacks as the news flow keeps shifting. Make sure you don’t go all-in with heavy positions. Don’t be fooled by short-term rebounds.🚨

Remember: expectations are one thing, but the situation can change at any moment due to the Fed’s future remarks and fluctuations in oil prices. In terms of trading, keep positions light, be patient, and wait for clear opportunities—protecting your principal should always come first.🚨#币安将上市Hyperliquid(HYPE) #美联储10月加息概率升至69.7%

饼哥HODL
·
--
No more trading coins next life

Save some time for walking with you at night

But not this life—this life, I’m going to win

Quoted content has been removed
$HYPE near 92 ground down for a whole day The 15-minute and 1-hour MACD both turned bullish (flipped red). It feels like it might bounce upward. But the 4-hour chart is still a dead cross, and the green bars haven’t fully closed out, so the larger timeframe is still in adjustment. For resistance, first look at 93.5 to 94; for support, 90 to 91. The contract data is more interesting: open interest rebounded from the morning low to around 8.3M. Based on the large holders’ long/short ratio by positioning, it’s around 1.8, slightly bullish. However, the basis is negative, and the funding rate is also -0.0056%. Futures are cheaper than spot, which suggests market sentiment isn’t particularly euphoric. The active buy/sell volume is back-and-forth, with no overwhelming one-sided advantage. My plan isn’t to jump in right away. I’ll wait for this 4-hour adjustment wave to finish. If it can consolidate sideways with lower volume around 90, then I’ll consider trying with a small position. Personal review only; not investment advice #hype $HYPE
$HYPE near 92 ground down for a whole day

The 15-minute and 1-hour MACD both turned bullish (flipped red). It feels like it might bounce upward. But the 4-hour chart is still a dead cross, and the green bars haven’t fully closed out, so the larger timeframe is still in adjustment. For resistance, first look at 93.5 to 94; for support, 90 to 91.

The contract data is more interesting: open interest rebounded from the morning low to around 8.3M. Based on the large holders’ long/short ratio by positioning, it’s around 1.8, slightly bullish.

However, the basis is negative, and the funding rate is also -0.0056%. Futures are cheaper than spot, which suggests market sentiment isn’t particularly euphoric. The active buy/sell volume is back-and-forth, with no overwhelming one-sided advantage.

My plan isn’t to jump in right away. I’ll wait for this 4-hour adjustment wave to finish. If it can consolidate sideways with lower volume around 90, then I’ll consider trying with a small position.

Personal review only; not investment advice
#hype $HYPE
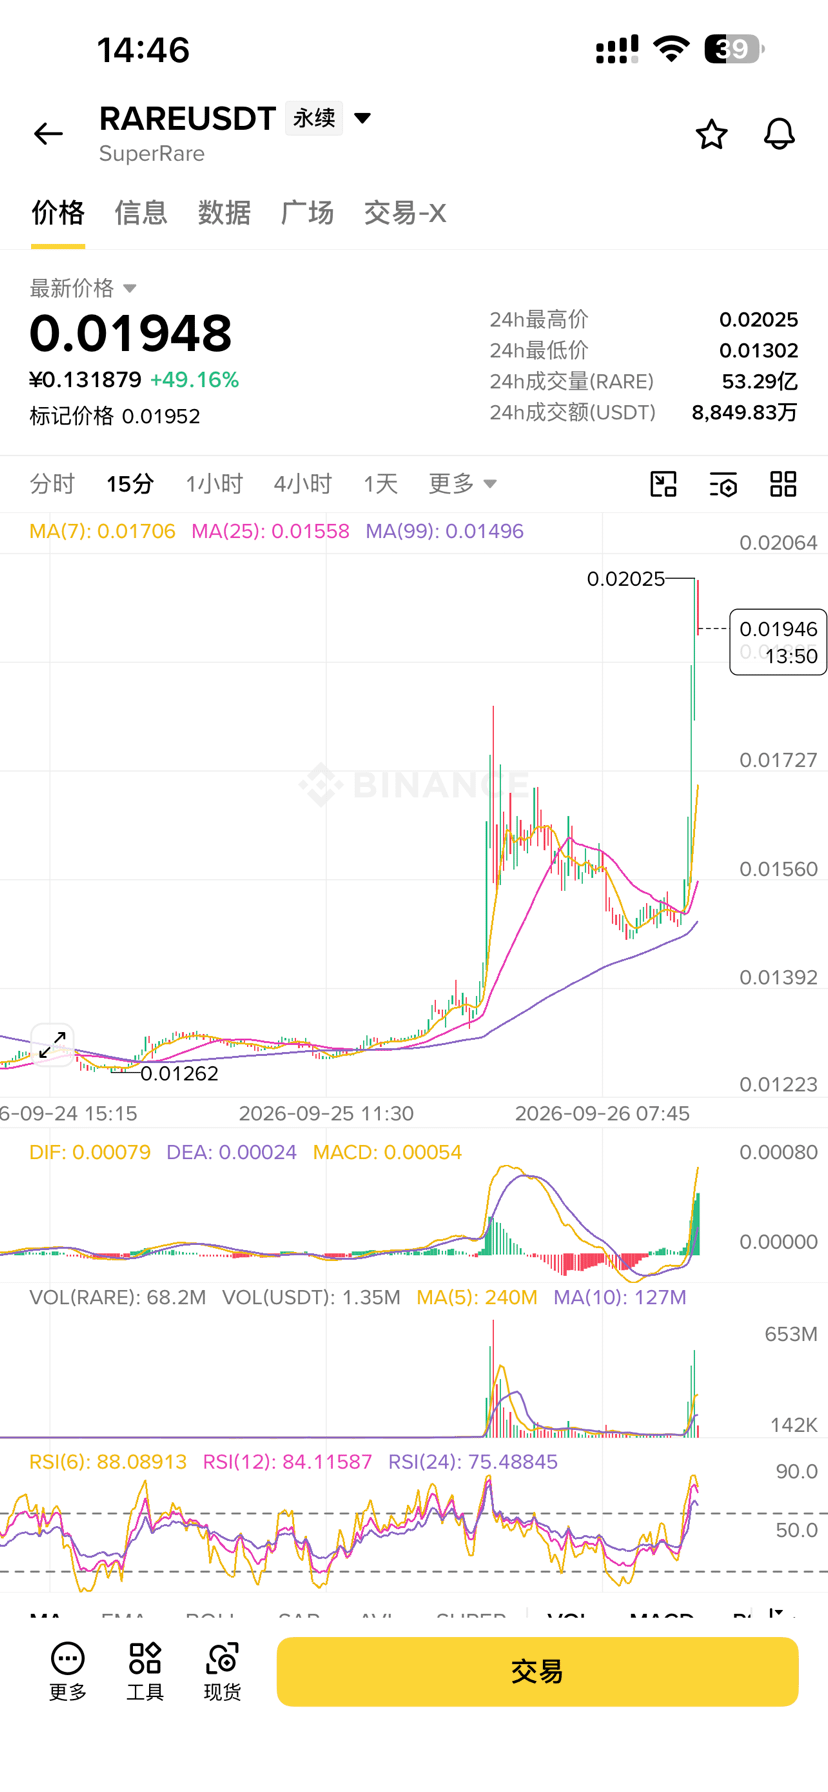
$RARE is up the most! In the past 24 hours it’s up 52%. It went straight from 0.013 to 0.0202, with trading volume of 84.82 million U. When an old coin suddenly pumps like this, there’s usually a story, but I didn’t go looking for news—I first checked the chart. The 15-minute RSI has reached 96, the 1-hour 89, the 4-hour 85, and even the daily is up to 90. Across the whole cycle it’s extremely overbought. MACD across all timeframes is forming golden crosses, and the red bars are still expanding—momentum is definitely strong. But the previous daily high is at 0.025; now it’s 0.0199, still a fair distance away. There are also plenty of trapped sellers above. I looked through the contract data too—more interesting still. Open interest jumped from 210 million straight to 410 million, doubling. But the large-holder long/short ratio dropped from 3.2 to 0.84, then bounced back to 1.99. That suggests that during the pump, whales were violently closing longs and even flipping sides, while retail chased. Funding rate is -0.26%—shorts are paying. With this kind of structure, either the main force is pumping up to distribute, or it’s squeezing shorts then continuing to pump. With this kind of vertical rally, if you chase in, the risk-reward is poor. Either wait for a pullback to the 0.016–0.017 zone where it consolidates on shrinking volume, or just watch it surge. What do you think—can RARE break back up to 0.025 this time? Or is it just being pumped to unload? Personal review only; not investment advice! $RARE #RARE {future}(RAREUSDT)
$RARE is up the most!

In the past 24 hours it’s up 52%. It went straight from 0.013 to 0.0202, with trading volume of 84.82 million U. When an old coin suddenly pumps like this, there’s usually a story, but I didn’t go looking for news—I first checked the chart.

The 15-minute RSI has reached 96, the 1-hour 89, the 4-hour 85, and even the daily is up to 90. Across the whole cycle it’s extremely overbought. MACD across all timeframes is forming golden crosses, and the red bars are still expanding—momentum is definitely strong. But the previous daily high is at 0.025; now it’s 0.0199, still a fair distance away. There are also plenty of trapped sellers above.

I looked through the contract data too—more interesting still. Open interest jumped from 210 million straight to 410 million, doubling. But the large-holder long/short ratio dropped from 3.2 to 0.84, then bounced back to 1.99. That suggests that during the pump, whales were violently closing longs and even flipping sides, while retail chased.

Funding rate is -0.26%—shorts are paying. With this kind of structure, either the main force is pumping up to distribute, or it’s squeezing shorts then continuing to pump.

With this kind of vertical rally, if you chase in, the risk-reward is poor. Either wait for a pullback to the 0.016–0.017 zone where it consolidates on shrinking volume, or just watch it surge.

What do you think—can RARE break back up to 0.025 this time? Or is it just being pumped to unload?

Personal review only; not investment advice!

$RARE #RARE
灼见Cryptosighted
·
--
🚨 A signal that’s easy to overlook has appeared:

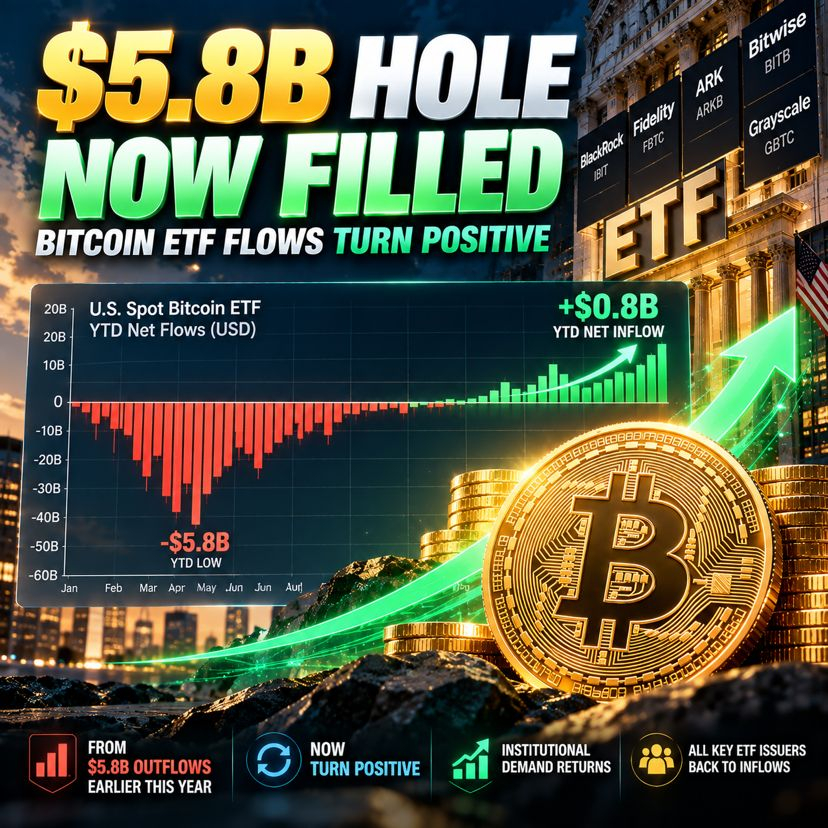
This year, BTC ETF saw cumulative net outflows of about $5.8 billion at one point.

Now, not only has it all been filled back in—year-to-date flows have turned positive again.

But here’s the interesting part:

💰 ETF funds keep coming back
🔥 Leverage is cooling off
📉 But BTC hasn’t broken through immediately
👀 The market is still digesting overhead supply

This suggests it may not be a question of “whether there’s money,” but rather:

Can the newly entering funds absorb the sell orders above?

If ETFs keep attracting capital while BTC gradually raises its lows and highs, this divergence is worth paying attention to.

A real big move often happens when capital changes first, and price confirms later.

Do you think right now it’s:

🟢 A buildup phase
🔴 Even funding can’t rescue the resistance

#BTC #ETH #BNB
Quoted content has been removed

慢就是快Mike
·
--
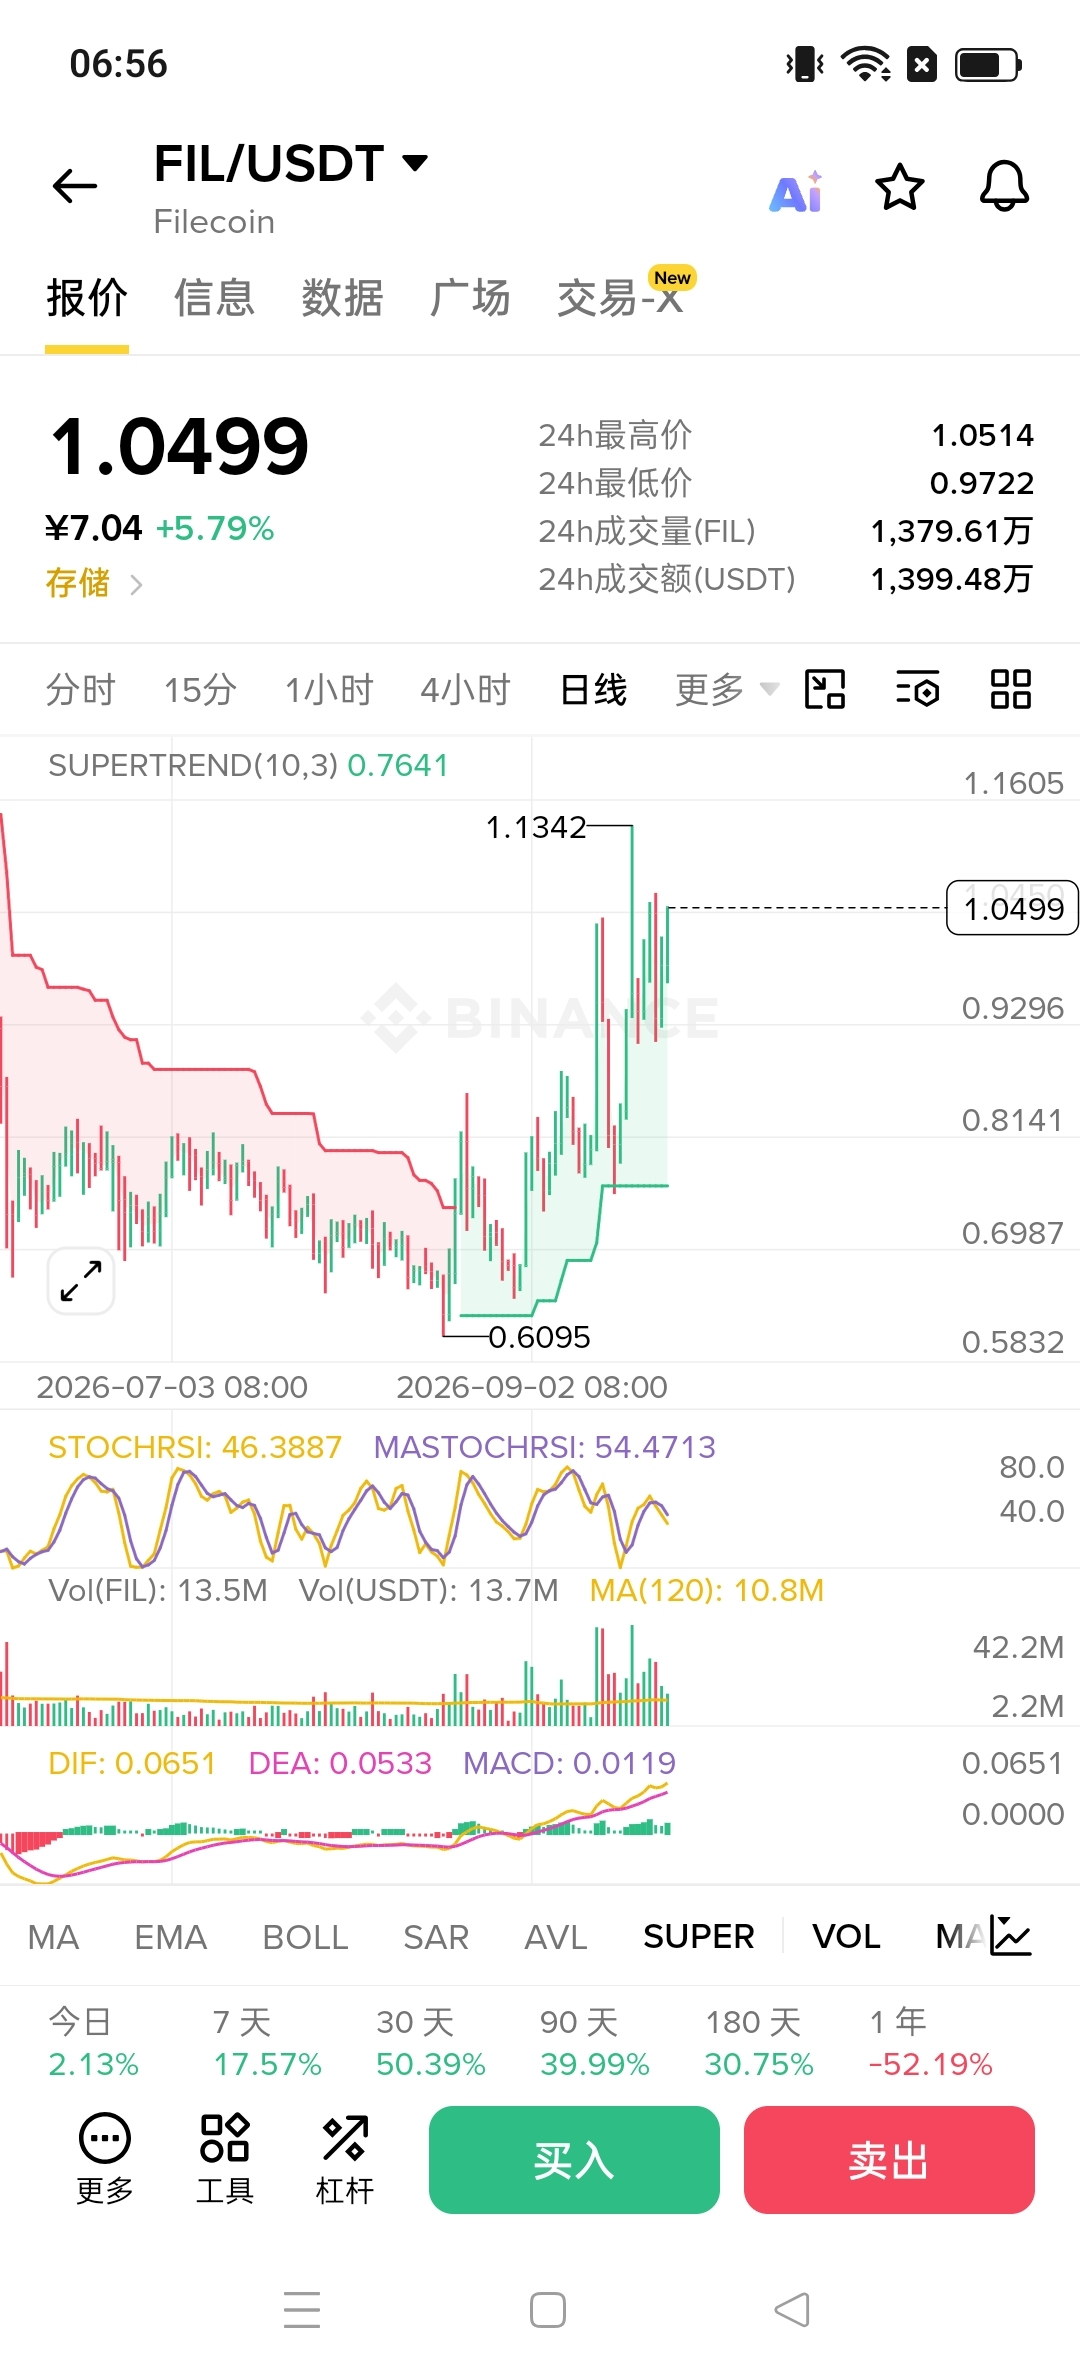
$FIL China-U.S. cooperation, crypto prosperity!

"People's Daily" says China and the United States should turn their strategic vision into action in 2026. A commentary in "People's Daily" points out that China and the U.S. should, in 2026—a year that is crucial to both countries' development—turn the vision of building a constructive and stable strategic relationship into concrete actions. The two countries should demonstrate the responsibility of major powers, implement the important consensus reached by the leaders of the two countries, and promote the building of a relationship characterized by cooperation as the main theme, moderate competition, controllable differences, and prospects for peace.
乘风Sunshine
·
--
If you truly want to make a living from trading, I suggest you seriously answer the following ten questions.

First:
How much money do I really want to make?
Second:
Can my principal support this goal?
Third:
What is the maximum drawdown I can tolerate?
Fourth:
After I lose ten times in a row, will I change the system?
Fifth:
Do I like the excitement of short-term trades, or do I prefer long-term compounding?
Sixth:
How much time per day am I willing to spend trading?
Seventh:
Am I really better at trends, ranging markets, or event-driven strategies?
Eighth:
When I lose money, do I analyze calmly, or do I rush to get it back?
Ninth:
When other people are making money, can I still resist the urge to chase?
Tenth:
If I haven’t made any money in the next six months, can I still keep following the system?

If you can’t answer all ten of these questions,
then what you might be missing right now isn’t a better indicator.
What you’re missing is:
not understanding yourself well enough.
Quoted content has been removed

呆猫 Web3
·
--
🧧🧧🎁🎁 The Mid-Autumn Moon is full—may your wallet have BTC and your heart feel whole.🌕
Happy Mid-Autumn Festival!
Want to learn more about BTC / Web3 / blockchain technology? Feel free to connect and chat together.

trader叫兽
·
--
🧧🧧🧧🧧
CZ’s mindset is still quite broad. Whenever a crypto theft or hacking incident occurs, the first thing he thinks of isn’t to take advantage of the situation or dig into the other party’s users; instead, he chooses to stand in support of them and, as much as possible, help them. This quality is worth the entire crypto community learning from.

Log in to explore more content
Join global crypto users on Binance Square
⚡️ Get latest and useful information about crypto.
💬 Trusted by the world’s largest crypto exchange.
👍 Discover real insights from verified creators.
Email / Phone number
Sitemap
Cookie Preferences
Platform T&Cs