$AAVE In one day it surged nearly 12%, yet the funding rate is cooling down—this doesn’t look like a typical “max-long chasing the rally.”
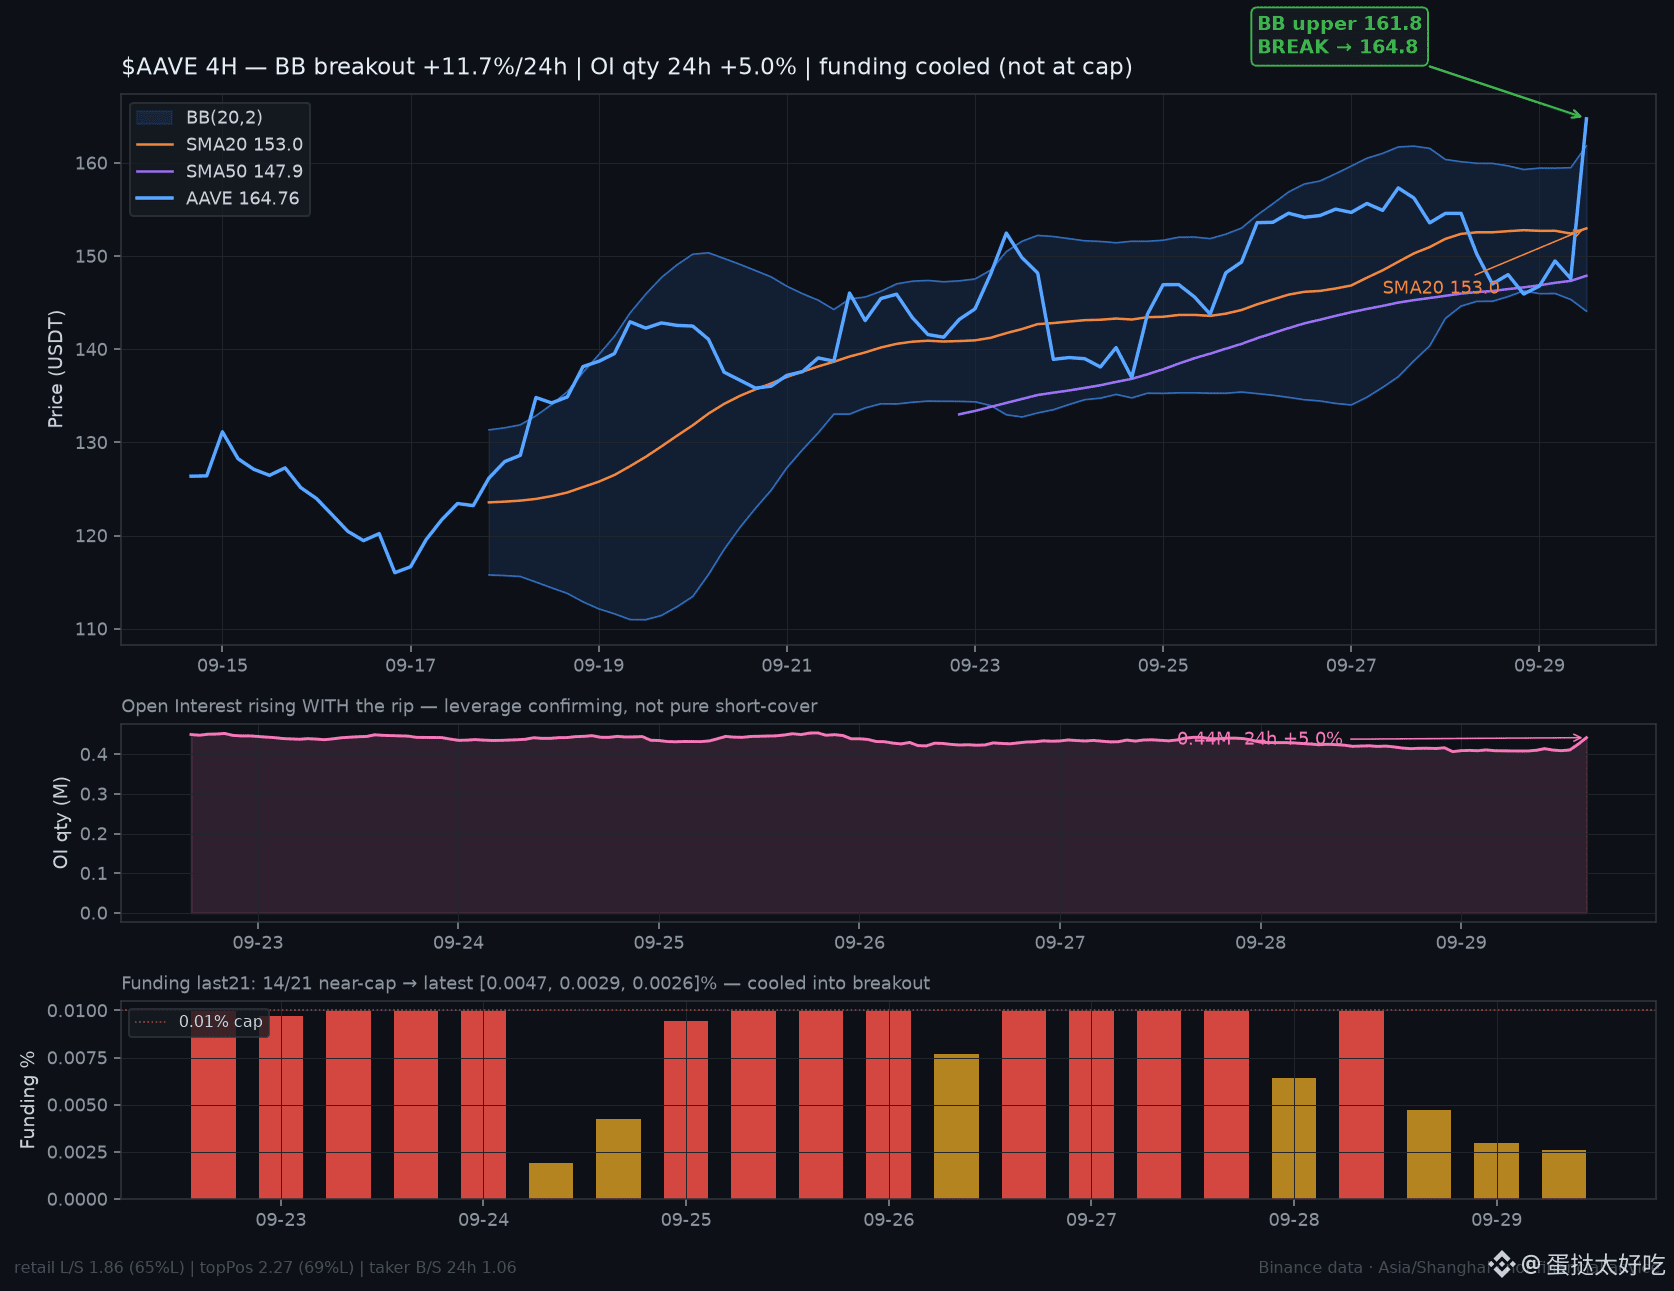
Spot is about 164.8, up +11.7% over 24h. The 4H chart directly broke through the upper Bollinger Band (around 161.8) and moved above the SMA20/50 (153/148). RSI14 is about 69, not yet at an extreme top. The key is the leverage structure: OI (open interest) increased +5.0% in 24h, with notional up about +10% to roughly $69 million. Positions grew alongside the price, not merely from short liquidations or short-covering that lifts price.
The funding rate is even more counterintuitive. In the past 21 periods, 14 of them exceeded the 0.01% cap, but the most recent three dropped to 0.0047% → 0.0029% → 0.0026%, and the estimate is only about 0.007%. The retail long/short ratio is 1.86 (about 65% longs), and the large-holder positioning ratio is 2.27 (about 69% longs)—the gap isn’t huge. The aggressive buy/sell ratio over 24h is about 1.06; the buy side is truly absorbing.
Most altcoins are “funding at the cap + OI shrinking + price gets smashed,” while AAVE here is “breakout + OI rising with price + funding cooling.” For the short-term, watch whether a pullback can see 162 (the upper Bollinger Band) turn into support. Below that is the SMA20 at 153. If it can’t hold 162, this move is more likely a false breakout.
Do you interpret the funding rate cooling as a healthy trend—or just a brief lull after the breakout?
$AAVE #AAVE #布林带 # contract data
Spot is about 164.8, up +11.7% over 24h. The 4H chart directly broke through the upper Bollinger Band (around 161.8) and moved above the SMA20/50 (153/148). RSI14 is about 69, not yet at an extreme top. The key is the leverage structure: OI (open interest) increased +5.0% in 24h, with notional up about +10% to roughly $69 million. Positions grew alongside the price, not merely from short liquidations or short-covering that lifts price.
The funding rate is even more counterintuitive. In the past 21 periods, 14 of them exceeded the 0.01% cap, but the most recent three dropped to 0.0047% → 0.0029% → 0.0026%, and the estimate is only about 0.007%. The retail long/short ratio is 1.86 (about 65% longs), and the large-holder positioning ratio is 2.27 (about 69% longs)—the gap isn’t huge. The aggressive buy/sell ratio over 24h is about 1.06; the buy side is truly absorbing.
Most altcoins are “funding at the cap + OI shrinking + price gets smashed,” while AAVE here is “breakout + OI rising with price + funding cooling.” For the short-term, watch whether a pullback can see 162 (the upper Bollinger Band) turn into support. Below that is the SMA20 at 153. If it can’t hold 162, this move is more likely a false breakout.
Do you interpret the funding rate cooling as a healthy trend—or just a brief lull after the breakout?
$AAVE #AAVE #布林带 # contract data