Binance Research found that a single number separates Bitcoin’s strong rallies from weak ones.
What do the 12 previous crossovers say about 293 days without direction
The Golden Cross forms when the 50-day moving average rises above the 200-day moving average. A Binance study categorized previous crossovers by the number of days in which $BTC closed below the 200-day moving average during the prior year.
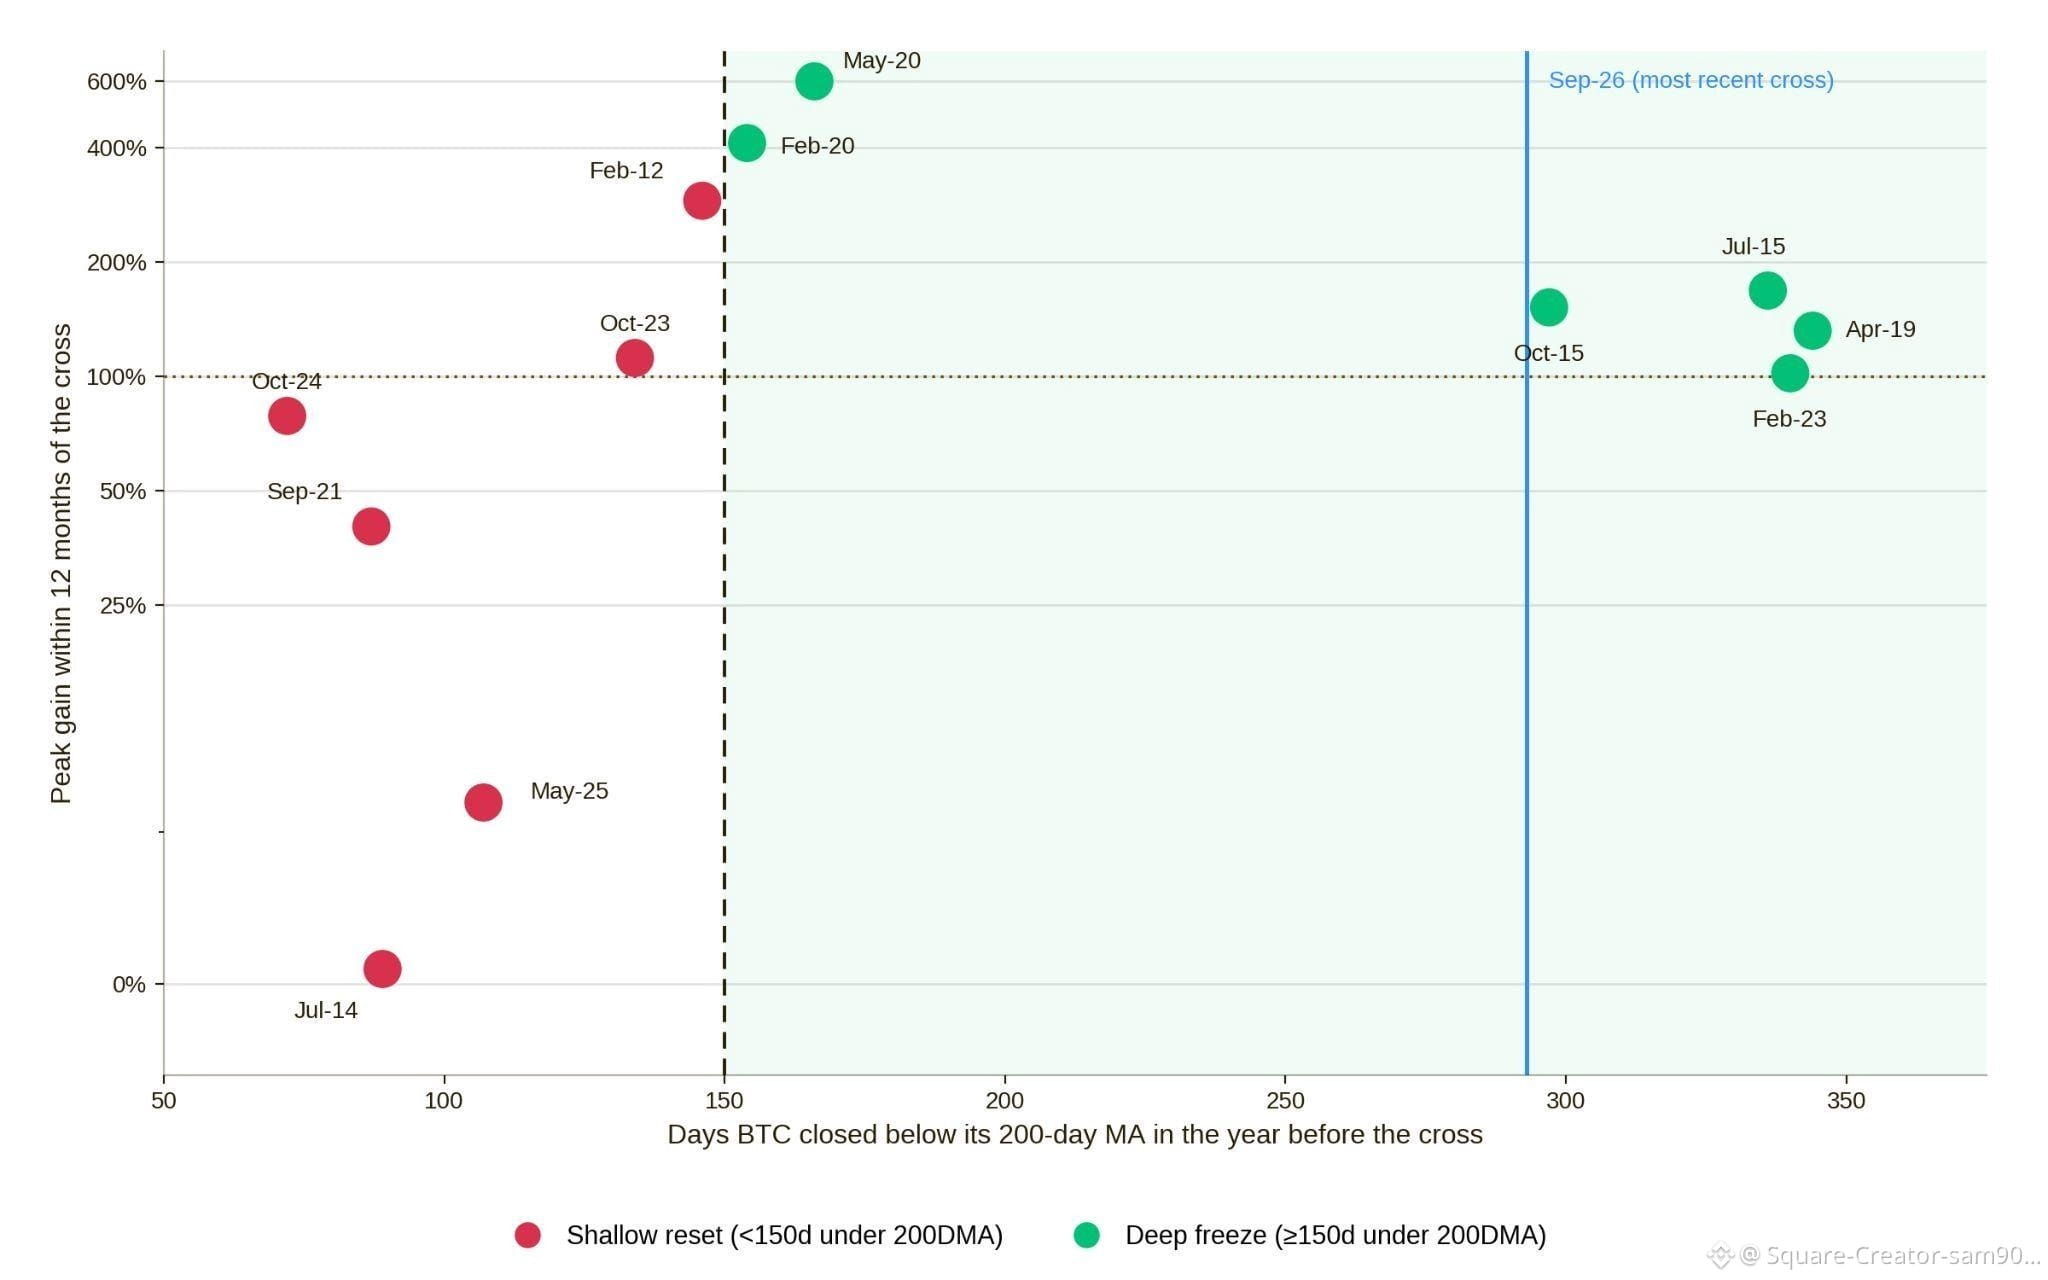
Six crossovers followed at least 150 of those days and saw near-maximum gains of roughly 100% to 600% within a year. By contrast, crossovers after shallow pullbacks were more varied, with 4 out of 6 reaching under 100% at most.
Binance charting showed that longer corrections did not automatically lead to bigger gains. The strongest spikes, in February and May 2020, came after just a little more than 150 days without direction.
The closest similarity on this metric came in October 2015, after about 297 days without the average. The crossover peaked at around 150% over the year.
A second long-term signal appeared on September 20, when $BTC closed at a weekly $81,159. That was considered the first close above the 50-week average since November 9, 2025.
What do the 12 previous crossovers say about 293 days without direction
The Golden Cross forms when the 50-day moving average rises above the 200-day moving average. A Binance study categorized previous crossovers by the number of days in which $BTC closed below the 200-day moving average during the prior year.
Six crossovers followed at least 150 of those days and saw near-maximum gains of roughly 100% to 600% within a year. By contrast, crossovers after shallow pullbacks were more varied, with 4 out of 6 reaching under 100% at most.
Binance charting showed that longer corrections did not automatically lead to bigger gains. The strongest spikes, in February and May 2020, came after just a little more than 150 days without direction.
The closest similarity on this metric came in October 2015, after about 297 days without the average. The crossover peaked at around 150% over the year.
A second long-term signal appeared on September 20, when $BTC closed at a weekly $81,159. That was considered the first close above the 50-week average since November 9, 2025.