$ETH Ethereum medium-term layout reference
The market will not move based on our expectations. For swing/medium-term trading, you must accept that opportunities need to be waited for—not created by opening positions frequently. Setting a stop-loss is not to guarantee you will be stopped out, but to define your maximum risk. Don’t fight the market. If there is no signal, stay quietly on the sidelines, respect the order book, and don’t subjectively go against it. Medium-term trading requires patience.
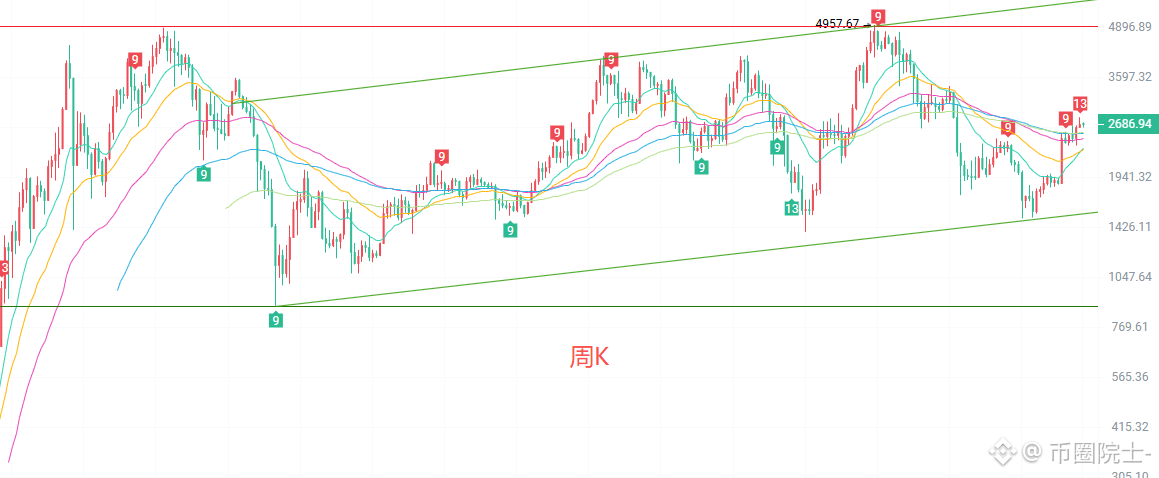
On the weekly chart, EMA15 is at 2323, and EMA30 is at 2300. The long- and medium-term moving averages are still trending upward, and the larger trend has not been completely broken down. The MACD’s DIF remains above the zero line; the red histogram bars are shrinking slightly, and bullish momentum is weakening. The Bollinger Bands’ upper and lower rails are converging. Price is moving around the Bollinger middle band. The prior high at 4957 is the pressure level for this larger-cycle leg. At the current stage, the price lacks the strength to push up quickly and instead has entered a wide-range box-style consolidation. Resistance is clear on the upside. Moving averages form strong support on the downside. At the weekly level, it’s a tug-of-war phase between bulls and bears; the trend direction has not yet chosen a breakout.
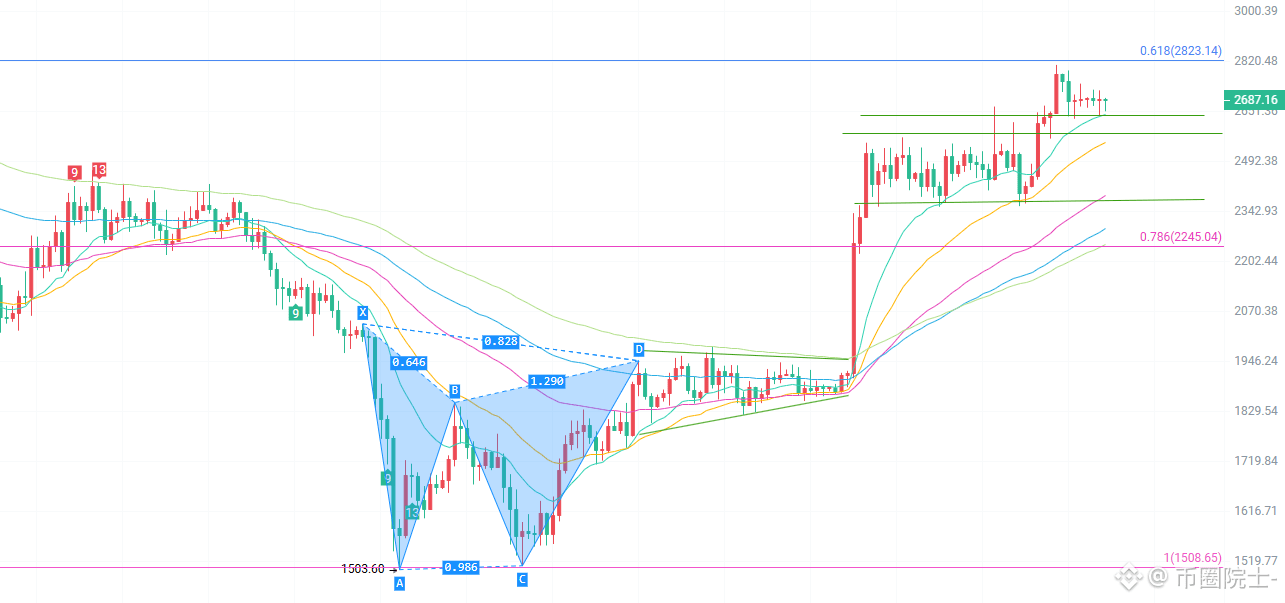
On the daily chart, short-term moving averages are sticking together and intertwining, and the short-term bull/bear forces are balanced. In the MACD, DIF crosses below DEA to form a dead cross; the green histogram is slowly expanding, and short-term bearish force is beginning to release. Bollinger Bands are narrowing, and price repeatedly contests around the Bollinger middle band. The prior daily low at 1503 is the starting point of this upswing. After recent rebounds, upward momentum has slowed. Candles have been repeatedly printing small bearish and small bullish candles, indicating choppy range movement. There is a lack of volume/strength to support an upside breakout, and there is not yet a continuous major drop to the downside. In the short term, it is entering a consolidation range while waiting for a directional choice.
Medium-term reference levels
Medium-term northbound: Pull back to 2560-2580, stop-loss at 2480. If that level breaks, it indicates that daily support has failed and the trend will weaken. Targets are in the 2850-3000 resistance zone.
Medium-term southbound: Rebound to 2860-2890, stop-loss at 2950. If price breaks upward, abandon the short idea; the target is near 2570.
For medium-term trading, be sure to keep position size light. In a choppy market, there are many false breakouts, so stop-losses must be executed strictly—don’t hold and “ride it out.”
#ETH走势分析
The market will not move based on our expectations. For swing/medium-term trading, you must accept that opportunities need to be waited for—not created by opening positions frequently. Setting a stop-loss is not to guarantee you will be stopped out, but to define your maximum risk. Don’t fight the market. If there is no signal, stay quietly on the sidelines, respect the order book, and don’t subjectively go against it. Medium-term trading requires patience.
On the weekly chart, EMA15 is at 2323, and EMA30 is at 2300. The long- and medium-term moving averages are still trending upward, and the larger trend has not been completely broken down. The MACD’s DIF remains above the zero line; the red histogram bars are shrinking slightly, and bullish momentum is weakening. The Bollinger Bands’ upper and lower rails are converging. Price is moving around the Bollinger middle band. The prior high at 4957 is the pressure level for this larger-cycle leg. At the current stage, the price lacks the strength to push up quickly and instead has entered a wide-range box-style consolidation. Resistance is clear on the upside. Moving averages form strong support on the downside. At the weekly level, it’s a tug-of-war phase between bulls and bears; the trend direction has not yet chosen a breakout.
On the daily chart, short-term moving averages are sticking together and intertwining, and the short-term bull/bear forces are balanced. In the MACD, DIF crosses below DEA to form a dead cross; the green histogram is slowly expanding, and short-term bearish force is beginning to release. Bollinger Bands are narrowing, and price repeatedly contests around the Bollinger middle band. The prior daily low at 1503 is the starting point of this upswing. After recent rebounds, upward momentum has slowed. Candles have been repeatedly printing small bearish and small bullish candles, indicating choppy range movement. There is a lack of volume/strength to support an upside breakout, and there is not yet a continuous major drop to the downside. In the short term, it is entering a consolidation range while waiting for a directional choice.
Medium-term reference levels
Medium-term northbound: Pull back to 2560-2580, stop-loss at 2480. If that level breaks, it indicates that daily support has failed and the trend will weaken. Targets are in the 2850-3000 resistance zone.
Medium-term southbound: Rebound to 2860-2890, stop-loss at 2950. If price breaks upward, abandon the short idea; the target is near 2570.
For medium-term trading, be sure to keep position size light. In a choppy market, there are many false breakouts, so stop-losses must be executed strictly—don’t hold and “ride it out.”
#ETH走势分析