

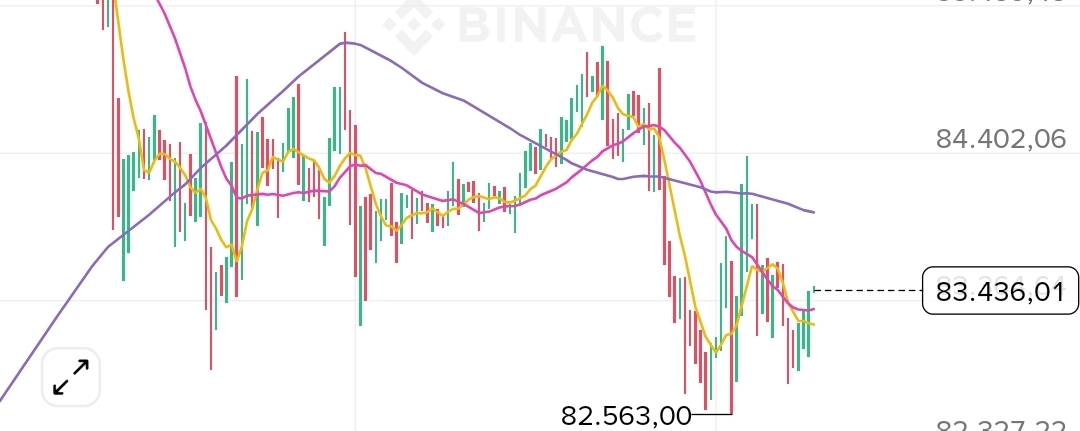

📊 Quick analysis of BTC/USDT (H1 timeframe - Binance)
💵 Current price: 83,436.01 USDT
🌏 1. Assessment of the Asia session (Morning - Afternoon) 📈
* Trend: The price is consolidating in a sideways range after forming a short-term bottom at 82,563.00 USDT 📉.
* Technical indicator: Lying below the MA(99) shows that the selling side still holds the upper hand 🔴. However, the selling pressure is gradually weakening on the MACD indicator; the MA(7) and MA(25) lines converge right below, acting as dynamic support 🟩.
* Volume: Trading is at low levels, with cautious capital waiting for the European session wave 🛒.
🇪🇺 2. Trading scenario for the European session ⚡
🟢 Scenario 1 (Up): Price breaks through the resistance zone 83,900 - 84,000 USDT 🚀. Next targets: 85,439 - 86,476 USDT. Strategy: Buy when the breakout is successful.
🔴 Scenario 2 (Down): Price fails to hold above the 83,800 level and turns back after breaking below the 83,100 USDT milestone 📉. Next targets: 82,563 - 81,250 USDT. Strategy: Short-term Sell.
⚠️ Recommendation: Be patient and wait for a confirmation candle at the start of the European session, and always set a Stop Loss to manage risk 🛡️.
#Bitcoin #BTCUSDT #Binance #CryptoAnalysis #TechnicalAnalysis