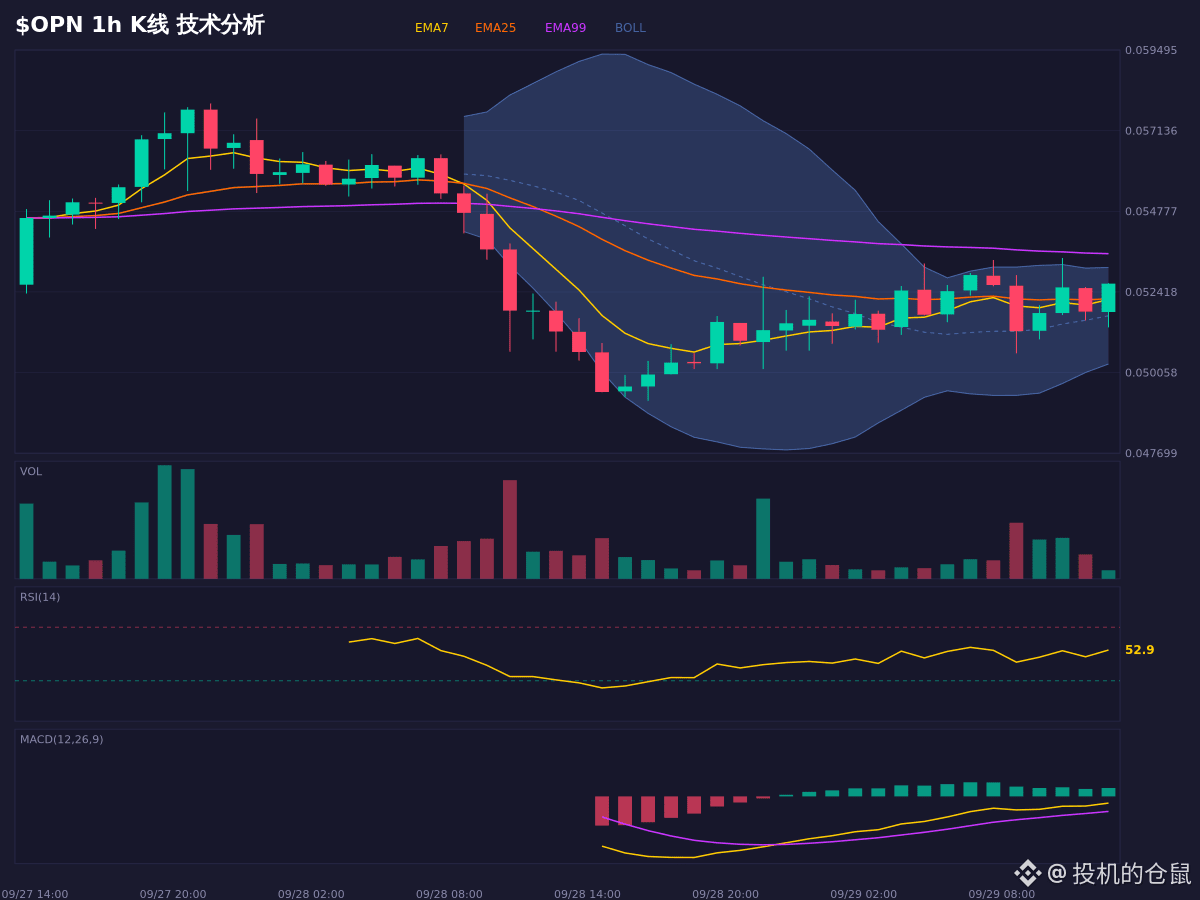
Old investors, let’s review this $OPN setup and see whether it can still be chased after rising 2.31%. First, the most striking contradictory signals: the moving average system is in the short-term bullish mode, but the Stoch RSI K-line has just crossed below the D-line—this kind of crossover usually suggests weakening short-term momentum. Even more concerning, the OBV energy flow has already shown signs of capital outflow, indicating that at the high level, someone is quietly distributing.
The price is currently trading above the EMA25, so the short-term bullish structure is still intact. However, if it breaks below the key level of 0.050192, the current logic will fail. For a more cautious approach, wait for a pullback into the observation range of 0.0513–0.0518 before deciding.
Wow, this stock moves up fast and drops fast—chasing after a pump really isn’t something you should do.
For market chart observation and scenario analysis only; not a record of trade execution.
$OPN #交易 #熊市 #Market sentiment
The price is currently trading above the EMA25, so the short-term bullish structure is still intact. However, if it breaks below the key level of 0.050192, the current logic will fail. For a more cautious approach, wait for a pullback into the observation range of 0.0513–0.0518 before deciding.
Wow, this stock moves up fast and drops fast—chasing after a pump really isn’t something you should do.
For market chart observation and scenario analysis only; not a record of trade execution.
$OPN #交易 #熊市 #Market sentiment