BTC— Today’s Technical Analysis | 29 Sep 2026
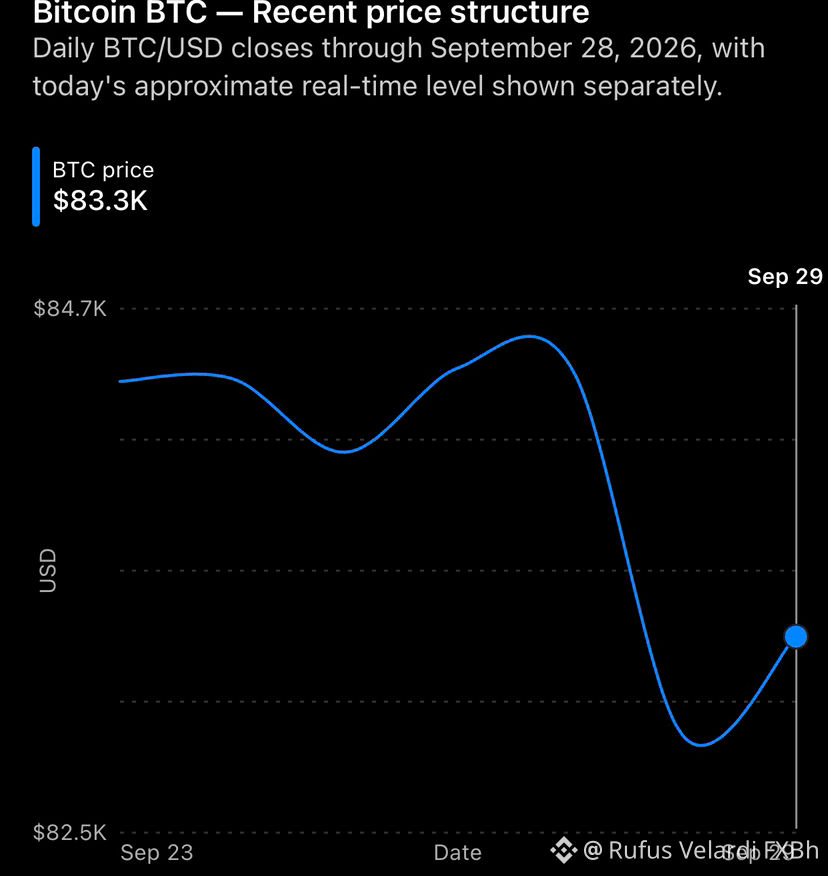
BTC is trading around $83.3K, down roughly 1–1.5% today. The immediate structure is a pullback from the $87.4K September high.
Level
Significance
$84,800–$85,000
Immediate resistance
$84,000–$84,500
First recovery zone
$82,500–$82,600
Important near-term support
$81,200
Next downside support
$87,300–$87,400
September high / major breakout area.
The current technical data puts the classic pivot around $83,384, with resistance around $83,783 / $84,014 / $84,414 and support around $83,152 / $82,753 / $82,521. RSI(14) is around 49.6, essentially neutral, while the MACD is negative.
$BTC
🔎 My read of the chart
Bullish scenario:
BTC holds $82.5K–$83K, recovers $84.8K–$85K, and then breaks the $87.4K September high. A sustained move above that high would materially change the short-term structure.
Bearish scenario:
A decisive break below $82.5K would put $81.2K into focus, with the possibility of a deeper correction if that level also fails. CoinMarketCap’s recent analysis similarly identified $82.57K as a key support and $80K as a potential lower target.
Important macro factor: U.S. Treasury yields above 5% and expectations around upcoming inflation data are currently putting pressure on risk assets, including BTC. At the same time, Binance Research reports that spot BTC ETF demand has remained positive, creating opposing forces in the market.
Bottom line: BTC is currently in a decision zone around $82.5K–$85K. I would watch those boundaries rather than chase the middle of the range.
#Bitcoin #BTCAlert #BitcoinBullish #CryptoNews #CryptoInvestor
BTC is trading around $83.3K, down roughly 1–1.5% today. The immediate structure is a pullback from the $87.4K September high.
Level
Significance
$84,800–$85,000
Immediate resistance
$84,000–$84,500
First recovery zone
$82,500–$82,600
Important near-term support
$81,200
Next downside support
$87,300–$87,400
September high / major breakout area.
The current technical data puts the classic pivot around $83,384, with resistance around $83,783 / $84,014 / $84,414 and support around $83,152 / $82,753 / $82,521. RSI(14) is around 49.6, essentially neutral, while the MACD is negative.
$BTC
🔎 My read of the chart
Bullish scenario:
BTC holds $82.5K–$83K, recovers $84.8K–$85K, and then breaks the $87.4K September high. A sustained move above that high would materially change the short-term structure.
Bearish scenario:
A decisive break below $82.5K would put $81.2K into focus, with the possibility of a deeper correction if that level also fails. CoinMarketCap’s recent analysis similarly identified $82.57K as a key support and $80K as a potential lower target.
Important macro factor: U.S. Treasury yields above 5% and expectations around upcoming inflation data are currently putting pressure on risk assets, including BTC. At the same time, Binance Research reports that spot BTC ETF demand has remained positive, creating opposing forces in the market.
Bottom line: BTC is currently in a decision zone around $82.5K–$85K. I would watch those boundaries rather than chase the middle of the range.
#Bitcoin #BTCAlert #BitcoinBullish #CryptoNews #CryptoInvestor