$XAUT $BTC
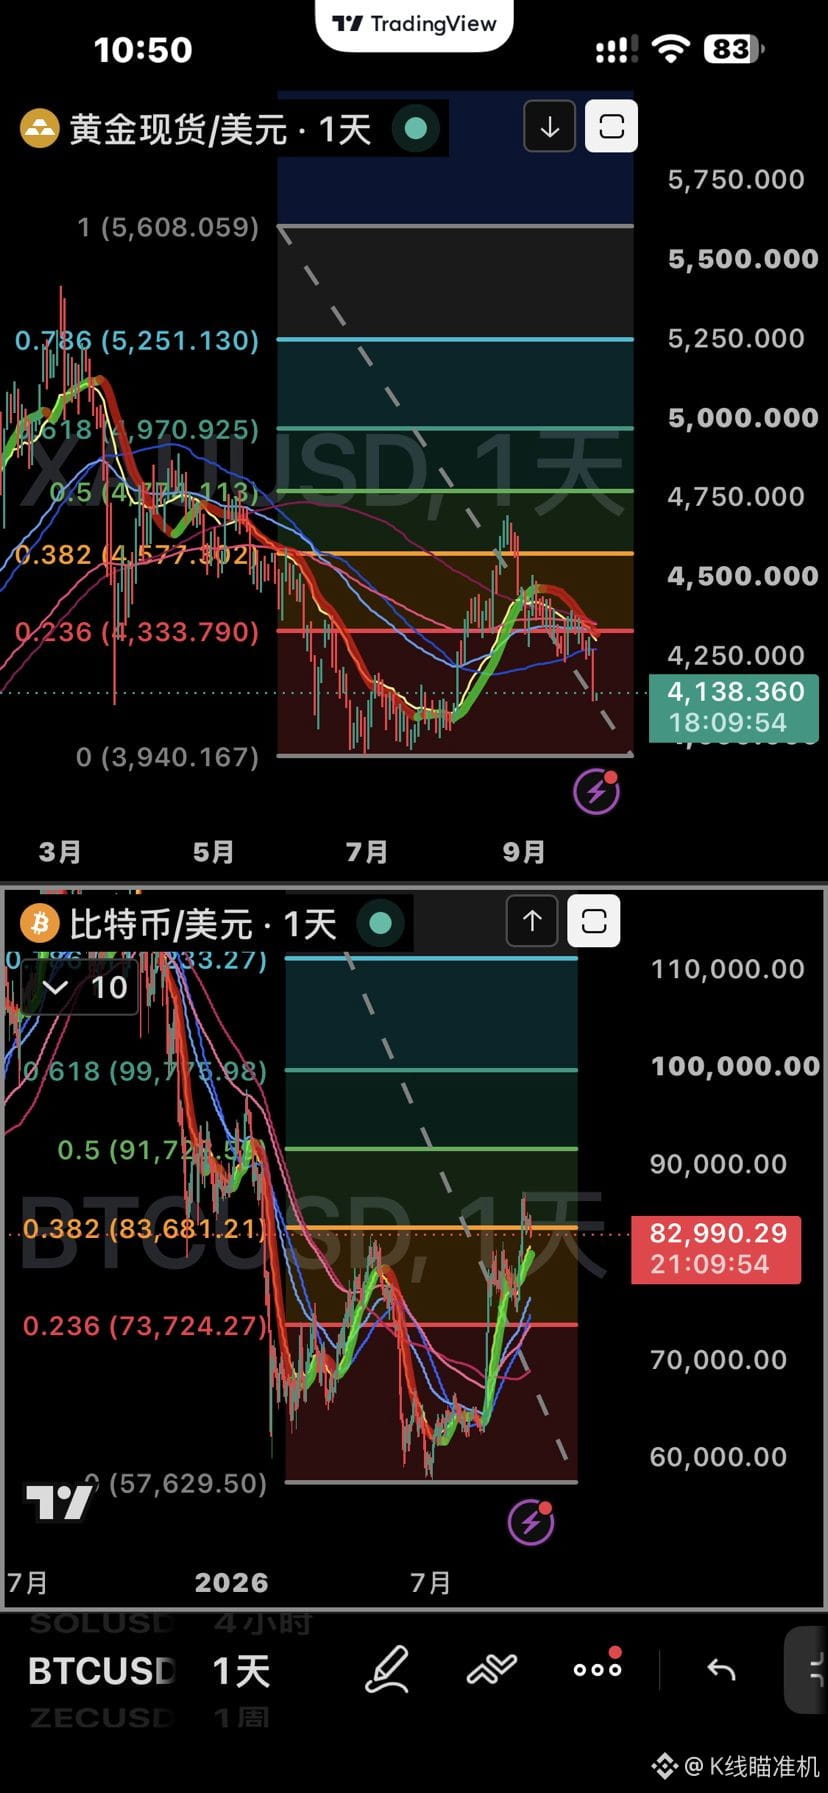
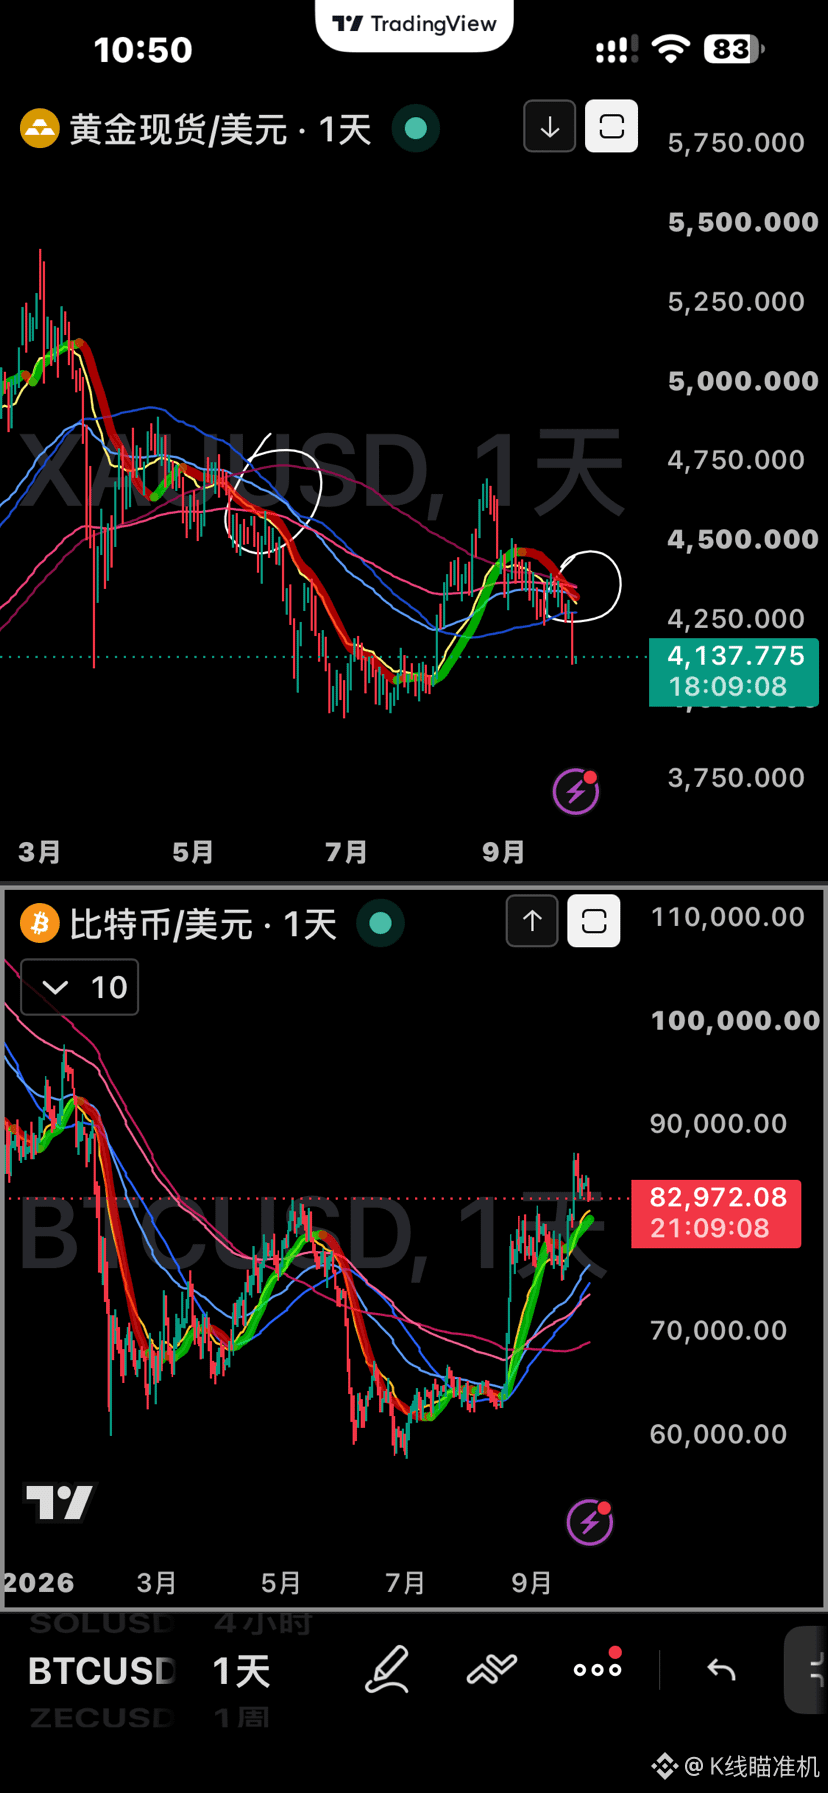
Bitcoin and gold’s recent daily chart uptrend is similar: this “feng shui ridge” appeared at the 0.382 level. However, gold moved first.
1. Gold has a very strong support zone between 4120 and 3950, which makes it hard to break through. One thing to note: the current daily-correction power accumulation zone is much larger than the one during the prior continuous decline. Whether the support zone can hold remains to be seen. If you go long and it returns to the daily “main base,” that would be the extreme limit.
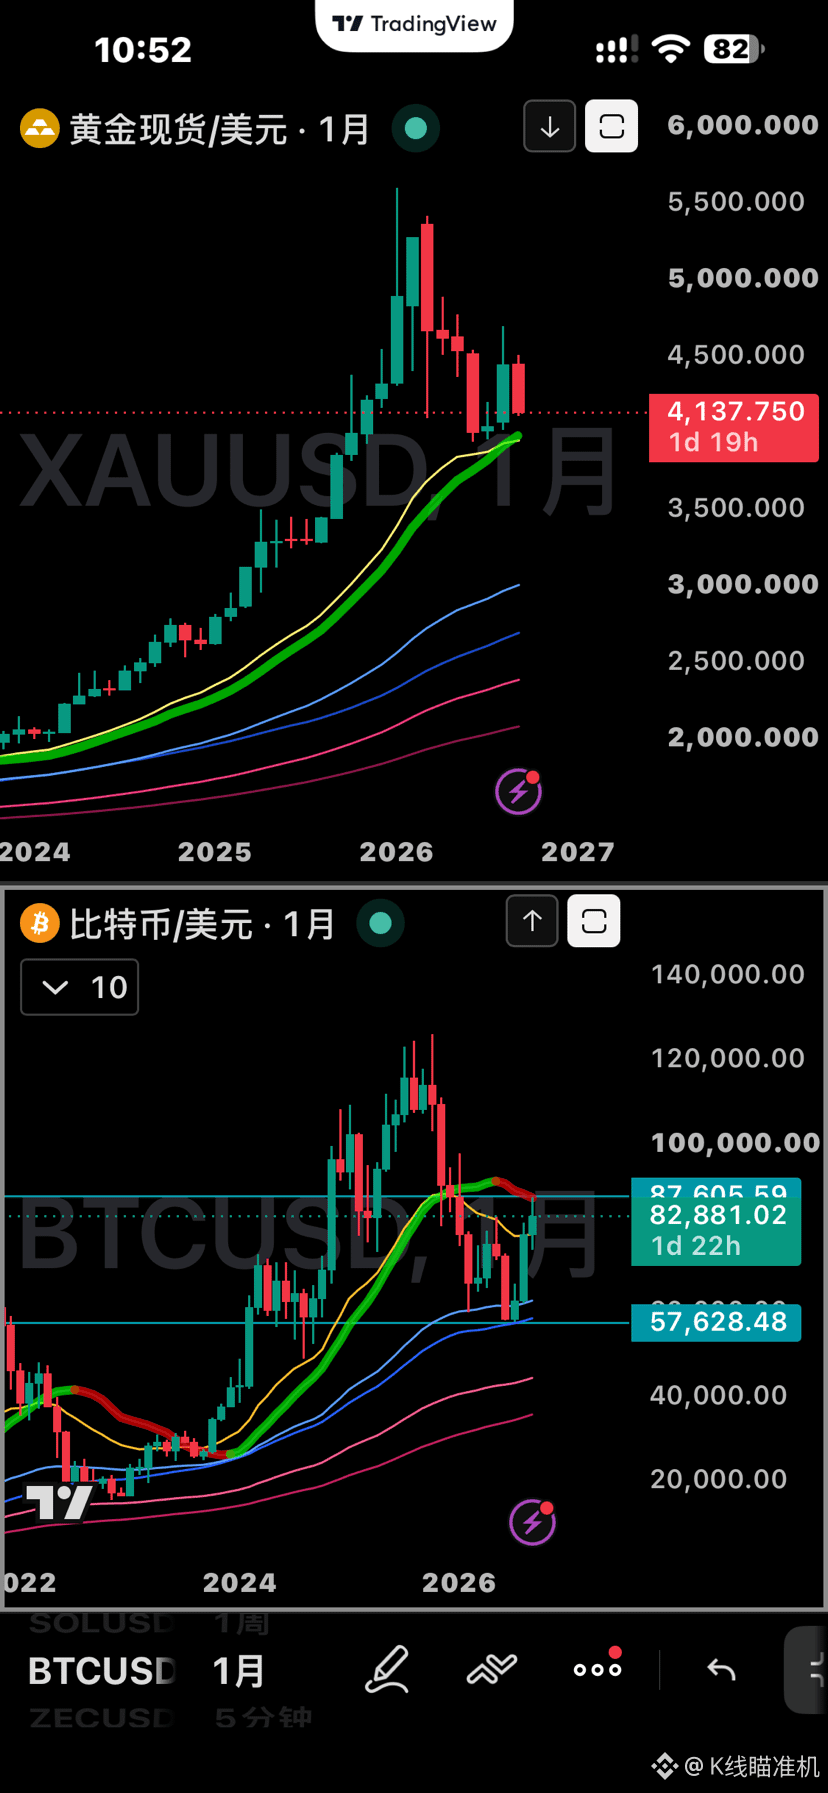
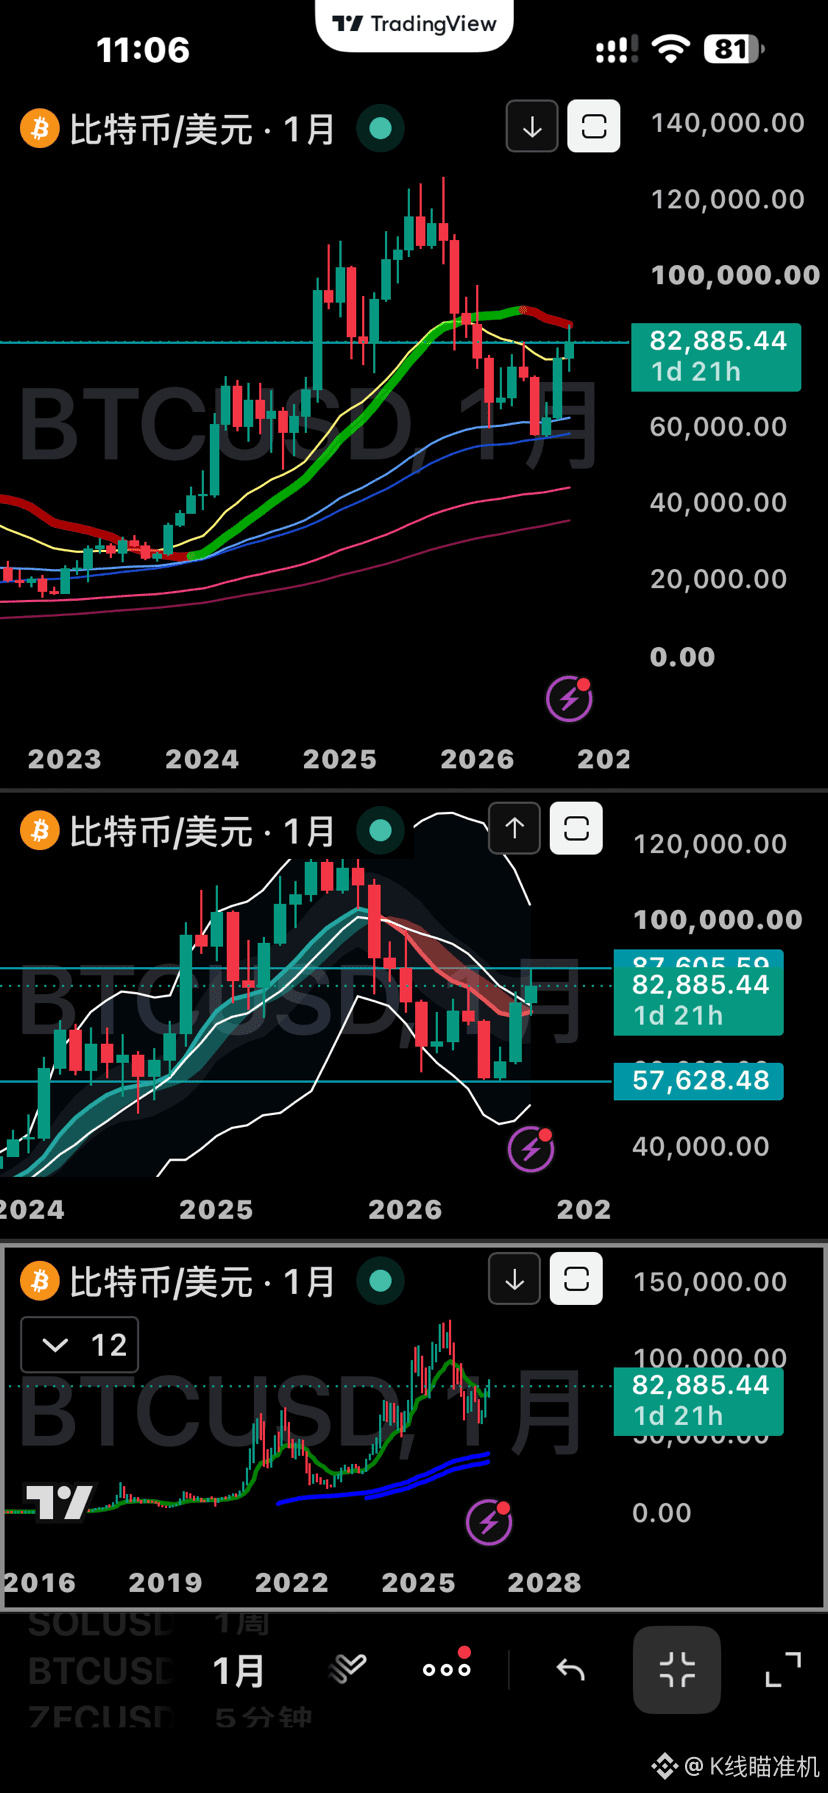
2. Bitcoin is at 0.382 and the 83,000 decomposition point. It is currently near the support area, at a critical intersection. Several attempts to break through were pushed back. If it breaks down and then the subsequent retest fails to hold, it will most likely follow gold’s path. Judging from the monthly chart trend, the outlook is still bullish. The question now is: if it breaks below 83,000 and then drops to what level, can you re-enter the trade again? …
Bitcoin and gold’s recent daily chart uptrend is similar: this “feng shui ridge” appeared at the 0.382 level. However, gold moved first.
1. Gold has a very strong support zone between 4120 and 3950, which makes it hard to break through. One thing to note: the current daily-correction power accumulation zone is much larger than the one during the prior continuous decline. Whether the support zone can hold remains to be seen. If you go long and it returns to the daily “main base,” that would be the extreme limit.
2. Bitcoin is at 0.382 and the 83,000 decomposition point. It is currently near the support area, at a critical intersection. Several attempts to break through were pushed back. If it breaks down and then the subsequent retest fails to hold, it will most likely follow gold’s path. Judging from the monthly chart trend, the outlook is still bullish. The question now is: if it breaks below 83,000 and then drops to what level, can you re-enter the trade again? …