$LINK 15,02.
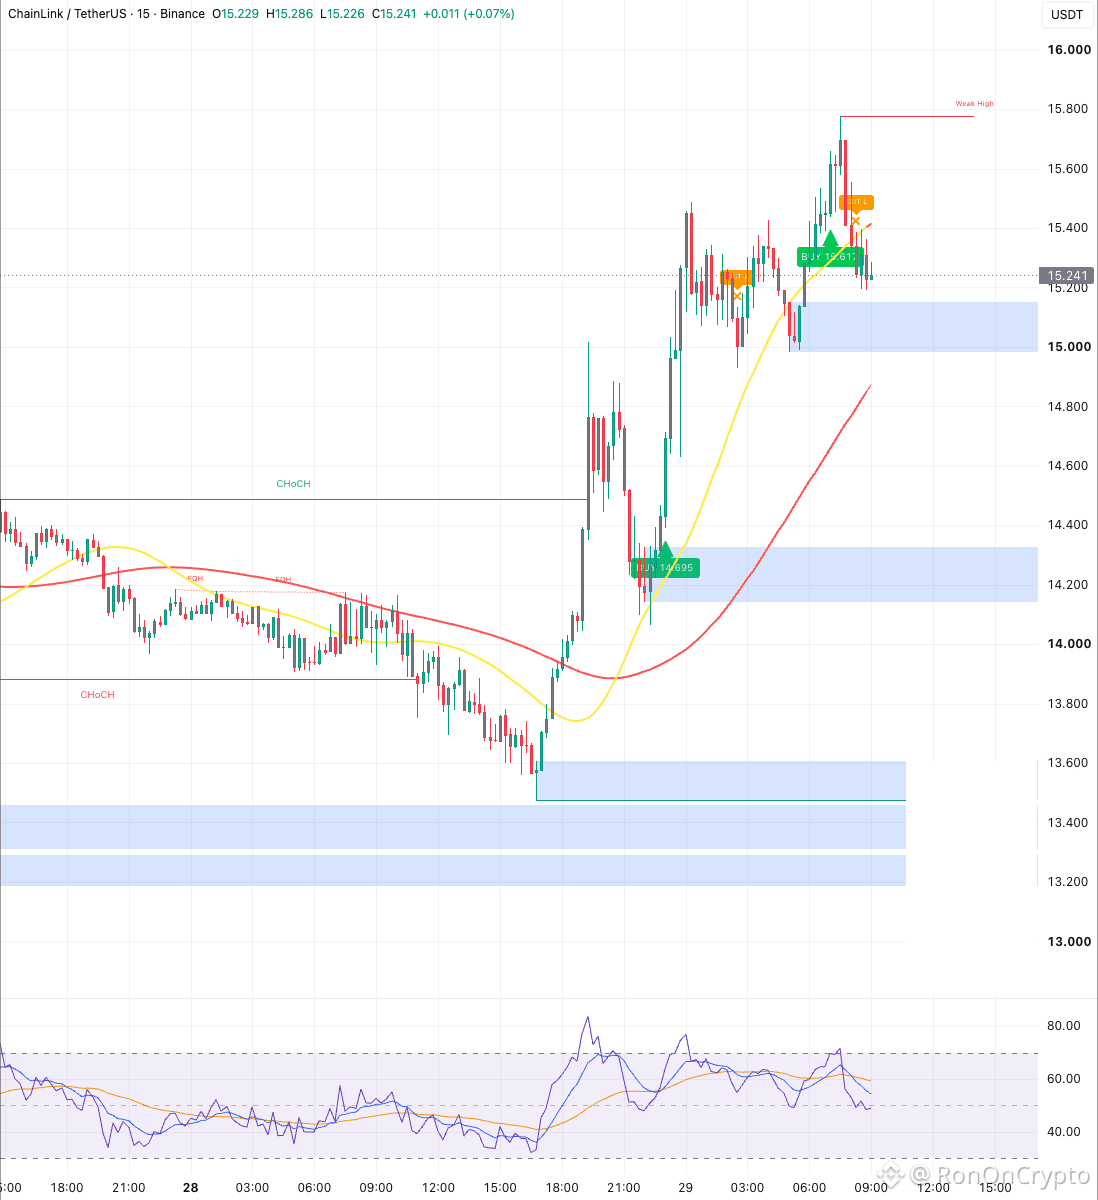
This morning it touched 15.78 and then pulled back. The 15m chart indicator entered a long at 15.61, but not long after, it exited. The smaller timeframe didn’t have enough strength to continue further.
Now the price has pulled back to just above the lower edge of the support zone 14.95–15.15 on the 15m and 30m charts, aligning with the 30m fast moving average. The alt indicators are all turning red at the same time, and LINK is being dragged along too.
If this zone holds, the nearest resistance is around 15.4, then 15.78. If 14.95 breaks, I’m watching 14.1–14.3, where the 1H chart moving average line sits.
The higher timeframe is still tilted upward. The “whale” accumulated about 2.5 million LINK over 10 days. But LINK is currently moving against $BTC ; if BTC falls, it’s hard for the alt to stand alone.
15.0 — is it going to hold or break through?
Personal observation only, not investment advice. Risk: 1%. There is always a stop point.
#LINK #Chainlink $LINK $BTC
This morning it touched 15.78 and then pulled back. The 15m chart indicator entered a long at 15.61, but not long after, it exited. The smaller timeframe didn’t have enough strength to continue further.
Now the price has pulled back to just above the lower edge of the support zone 14.95–15.15 on the 15m and 30m charts, aligning with the 30m fast moving average. The alt indicators are all turning red at the same time, and LINK is being dragged along too.
If this zone holds, the nearest resistance is around 15.4, then 15.78. If 14.95 breaks, I’m watching 14.1–14.3, where the 1H chart moving average line sits.
The higher timeframe is still tilted upward. The “whale” accumulated about 2.5 million LINK over 10 days. But LINK is currently moving against $BTC ; if BTC falls, it’s hard for the alt to stand alone.
15.0 — is it going to hold or break through?
Personal observation only, not investment advice. Risk: 1%. There is always a stop point.
#LINK #Chainlink $LINK $BTC