

易琳Ten
176 Posts

易琳Ten
交易是修行,盈利是结果,纪律是信仰。🐺📈
69 Following
22.1K+ Followers
8.9K+ Liked
Posts
All
Quotes
Videos

PINNED


jack jacky
·
--
The future belongs to those who see the light. 🚀
While the rest of the market watches the charts, the $LUCIC movement is blazing its own trail. Built on community, transparency, and a vision that stands out among the giants.
We aren't just participating in the crypto evolution—we are fueling the fire. 🔥💎
#LucidumCoin #LUCIC #BNBChain #CryptoCommunity #Bullish #DeFi #Altcoins
While the rest of the market watches the charts, the $LUCIC movement is blazing its own trail. Built on community, transparency, and a vision that stands out among the giants.
We aren't just participating in the crypto evolution—we are fueling the fire. 🔥💎
#LucidumCoin #LUCIC #BNBChain #CryptoCommunity #Bullish #DeFi #Altcoins


Mahi_玛希BNB
·
--
🚀 **$ETH — More Than Just a Token!**
Ethereum continues to power a huge part of the **Web3 ecosystem**, from smart contracts to DeFi and beyond. 🔥
The market is always moving, and ETH** remains one of the tokens worth keeping on your radar. 👀
Are you watching the next ETH move? 📈
$BNB $BTC
#ETH #Ethereum #Crypto #Web3 #defi #BinanceSquare #ETHArmy #CryptoCommunity #blockchain
Ethereum continues to power a huge part of the **Web3 ecosystem**, from smart contracts to DeFi and beyond. 🔥
The market is always moving, and ETH** remains one of the tokens worth keeping on your radar. 👀
Are you watching the next ETH move? 📈
$BNB $BTC
#ETH #Ethereum #Crypto #Web3 #defi #BinanceSquare #ETHArmy #CryptoCommunity #blockchain


悠哉独自在
·
--
ZEC fell from 1695 to 1376—was this round a leveraged “big cleanup,” or is the market really over?
This ZEC drop has indeed been pretty brutal.
From the high at 1695, it got dumped straight down—hitting a low around 1367. Now it’s hovering near 1376, and it’s down nearly 13 points in a single day.
Why did it fall this much?
Mainly because it had already surged too far beforehand. In the last 30 days it rose 64%, and over 180 days it jumped more than 4x. The profit positions piled up heavily—so once there’s even a little “wind and grass,” it easily triggers a chain-reaction stampede.
The daily chart is still holding and hasn’t fully gone bad, but the 4-hour MACD has already formed a dead cross, the green histogram is still expanding, and the 1-hour and 15-minute moving averages are all pressing downward.
On the short-term charts, weakness is obvious.
On the 4-hour timeframe, open interest (position size) dropped from 219 million to 155 million—leverage funds are withdrawing like crazy.
Funding rates even flashed down to -0.05% at one point, and the long/short account ratio fell directly to 0.70.
That suggests retail traders on this side are actually疯狂短空 (aggressively going short).
Next, let’s look at 1367—this is today’s low, and it’s the short-term line between life and death.
If it breaks, chances are it will test 1315.
Resistance is at 1483; above that is 1592.
Unless price can get back above 1483, any rebounds can only be viewed as weak rebounds.
If 1367 can hold up, and the trading volume shrinks and it goes sideways for a few days, then this move is likely a violent washout—washing out the leverage, after which there may still be opportunities.
But if it directly breaks through 1367, don’t try to guess the bottom—downside room may open up further.
My plan is simple:
I’m not rushing to buy.
Wait until it stops falling—if it stabilizes and consolidates with reduced volume around 1367 or 1315, then consider trying with a small position.
What do you think this ZEC move is—“pulling over cars to pick up people,” or the end of the trend?
#zec #zcash $ZEC
This ZEC drop has indeed been pretty brutal.
From the high at 1695, it got dumped straight down—hitting a low around 1367. Now it’s hovering near 1376, and it’s down nearly 13 points in a single day.
Why did it fall this much?
Mainly because it had already surged too far beforehand. In the last 30 days it rose 64%, and over 180 days it jumped more than 4x. The profit positions piled up heavily—so once there’s even a little “wind and grass,” it easily triggers a chain-reaction stampede.
The daily chart is still holding and hasn’t fully gone bad, but the 4-hour MACD has already formed a dead cross, the green histogram is still expanding, and the 1-hour and 15-minute moving averages are all pressing downward.
On the short-term charts, weakness is obvious.
On the 4-hour timeframe, open interest (position size) dropped from 219 million to 155 million—leverage funds are withdrawing like crazy.
Funding rates even flashed down to -0.05% at one point, and the long/short account ratio fell directly to 0.70.
That suggests retail traders on this side are actually疯狂短空 (aggressively going short).
Next, let’s look at 1367—this is today’s low, and it’s the short-term line between life and death.
If it breaks, chances are it will test 1315.
Resistance is at 1483; above that is 1592.
Unless price can get back above 1483, any rebounds can only be viewed as weak rebounds.
If 1367 can hold up, and the trading volume shrinks and it goes sideways for a few days, then this move is likely a violent washout—washing out the leverage, after which there may still be opportunities.
But if it directly breaks through 1367, don’t try to guess the bottom—downside room may open up further.
My plan is simple:
I’m not rushing to buy.
Wait until it stops falling—if it stabilizes and consolidates with reduced volume around 1367 or 1315, then consider trying with a small position.
What do you think this ZEC move is—“pulling over cars to pick up people,” or the end of the trend?
#zec #zcash $ZEC

Mira小白桃
·
--
BullishHow to look at BTC and ETH in October?
My view for October is still slightly bullish, but I don’t see it as a straight line upward. It’s more likely to be “rally, consolidation/whipsaw, then a further choice of direction.”
First, let’s talk about BTC.
Currently BTC is ranging around 84K. In the short term, the key support to watch is 82K–83K. On the upside, first look at 85K–87K, then 90K–92K.
Over the past week, U.S. spot BTC ETF net inflows were about $2.4 billion, which suggests institutional capital is still being absorbed. At the same time, the 10-year U.S. Treasury yield has already risen to above 5.2%, and macro pressure is also increasing.
So in October, the most important thing for BTC isn’t trying to guess the top, but seeing whether key support can keep moving higher.
As long as 82K–83K holds, any pullback is more likely to be understood as consolidation/whipsaw within the uptrend. If 85K–87K is broken through again and able to hold, then the next target is around 90K.
If 82K–83K breaks down, then look at 80K–81K.
Now ETH.
ETH is currently around 2600–2700, and it has already tested around 2800 multiple times.
Recently, the spot ETH ETF saw about $690 million in net inflows over the week, and BitMine’s holdings have also broken through 6 million ETH. The institutional capital and the long-term allocation logic still remain.
So in October, I mainly watch:
Whether 2600–2660 can hold;
Whether 2750–2820 can break through;
If 2800 truly holds, then look next at around 3000.
But if the attempt to push above 2800 fails again, ETH may continue ranging between 2600–2800, or even pull back to lower support.
In October, there are also several very important macro events:
U.S. September Non-Farm Payrolls will be released on October 2;
September CPI will be released on October 14;
The FOMC meeting will be held on October 27–28.
So my October outlook is simple:
BTC: as long as 82K–83K holds, watch 85K–87K; after a breakout, look at 90K–92K.
ETH: as long as 2600–2660 holds, watch 2750–2820; if 2800 breaks through, then look at 3000.
For the bigger picture, I’m still bullish, but I won’t chase.
What really matters in October isn’t guessing every day whether prices will rise or fall, but waiting for the market to confirm support and resistance one by one.
If the trend isn’t broken, be patient and wait. If resistance hasn’t been broken, don’t FOMO. And if you see consolidation/whipsaw, don’t casually treat it as a reversal.
No trade calls, no follow-along trades—just sharing my trading logic and market views.
My view for October is still slightly bullish, but I don’t see it as a straight line upward. It’s more likely to be “rally, consolidation/whipsaw, then a further choice of direction.”
First, let’s talk about BTC.
Currently BTC is ranging around 84K. In the short term, the key support to watch is 82K–83K. On the upside, first look at 85K–87K, then 90K–92K.
Over the past week, U.S. spot BTC ETF net inflows were about $2.4 billion, which suggests institutional capital is still being absorbed. At the same time, the 10-year U.S. Treasury yield has already risen to above 5.2%, and macro pressure is also increasing.
So in October, the most important thing for BTC isn’t trying to guess the top, but seeing whether key support can keep moving higher.
As long as 82K–83K holds, any pullback is more likely to be understood as consolidation/whipsaw within the uptrend. If 85K–87K is broken through again and able to hold, then the next target is around 90K.
If 82K–83K breaks down, then look at 80K–81K.
Now ETH.
ETH is currently around 2600–2700, and it has already tested around 2800 multiple times.
Recently, the spot ETH ETF saw about $690 million in net inflows over the week, and BitMine’s holdings have also broken through 6 million ETH. The institutional capital and the long-term allocation logic still remain.
So in October, I mainly watch:
Whether 2600–2660 can hold;
Whether 2750–2820 can break through;
If 2800 truly holds, then look next at around 3000.
But if the attempt to push above 2800 fails again, ETH may continue ranging between 2600–2800, or even pull back to lower support.
In October, there are also several very important macro events:
U.S. September Non-Farm Payrolls will be released on October 2;
September CPI will be released on October 14;
The FOMC meeting will be held on October 27–28.
So my October outlook is simple:
BTC: as long as 82K–83K holds, watch 85K–87K; after a breakout, look at 90K–92K.
ETH: as long as 2600–2660 holds, watch 2750–2820; if 2800 breaks through, then look at 3000.
For the bigger picture, I’m still bullish, but I won’t chase.
What really matters in October isn’t guessing every day whether prices will rise or fall, but waiting for the market to confirm support and resistance one by one.
If the trend isn’t broken, be patient and wait. If resistance hasn’t been broken, don’t FOMO. And if you see consolidation/whipsaw, don’t casually treat it as a reversal.
No trade calls, no follow-along trades—just sharing my trading logic and market views.
易琳Ten
·
--
Many people are trying to describe the major drawdown at the beginning of 2023,
attempting to fit today’s market conditions using historical price action.
But what I want to say is:
History can rhyme, but it doesn’t simply repeat.
I’m more inclined to believe that we are still in Stage D.
However, before the target area is fully reached, the market may not necessarily replicate that year’s deep drawdown.
So, you can reference history, but don’t let it constrain you.
Past price action can help us understand the market’s rhythm,
but it cannot become a script for predicting the future.
Price movements may look similar, but the rhythm may not be the same;
structure can be replicated, but the path won’t be exactly repeated.
What truly matters in trading isn’t finding a historical copy,
but continuously adjusting your judgment based on current price, structure, and changes in capital.
attempting to fit today’s market conditions using historical price action.
But what I want to say is:
History can rhyme, but it doesn’t simply repeat.
I’m more inclined to believe that we are still in Stage D.
However, before the target area is fully reached, the market may not necessarily replicate that year’s deep drawdown.
So, you can reference history, but don’t let it constrain you.
Past price action can help us understand the market’s rhythm,
but it cannot become a script for predicting the future.
Price movements may look similar, but the rhythm may not be the same;
structure can be replicated, but the path won’t be exactly repeated.
What truly matters in trading isn’t finding a historical copy,
but continuously adjusting your judgment based on current price, structure, and changes in capital.



帮帮Bonnie
·
--
Live with open‑heartedness, stay calm and self‑consistent.
Live with open‑heartedness, stay calm and self‑consistent.
#比特币升破85200美元
Live with open‑heartedness, stay calm and self‑consistent.
#比特币升破85200美元


RCB signal
·
--
.$ZEC
.
claim 🎁🎁🎁🎁👈
.
claim 2, 🎁🎁🎁🎁👈
.
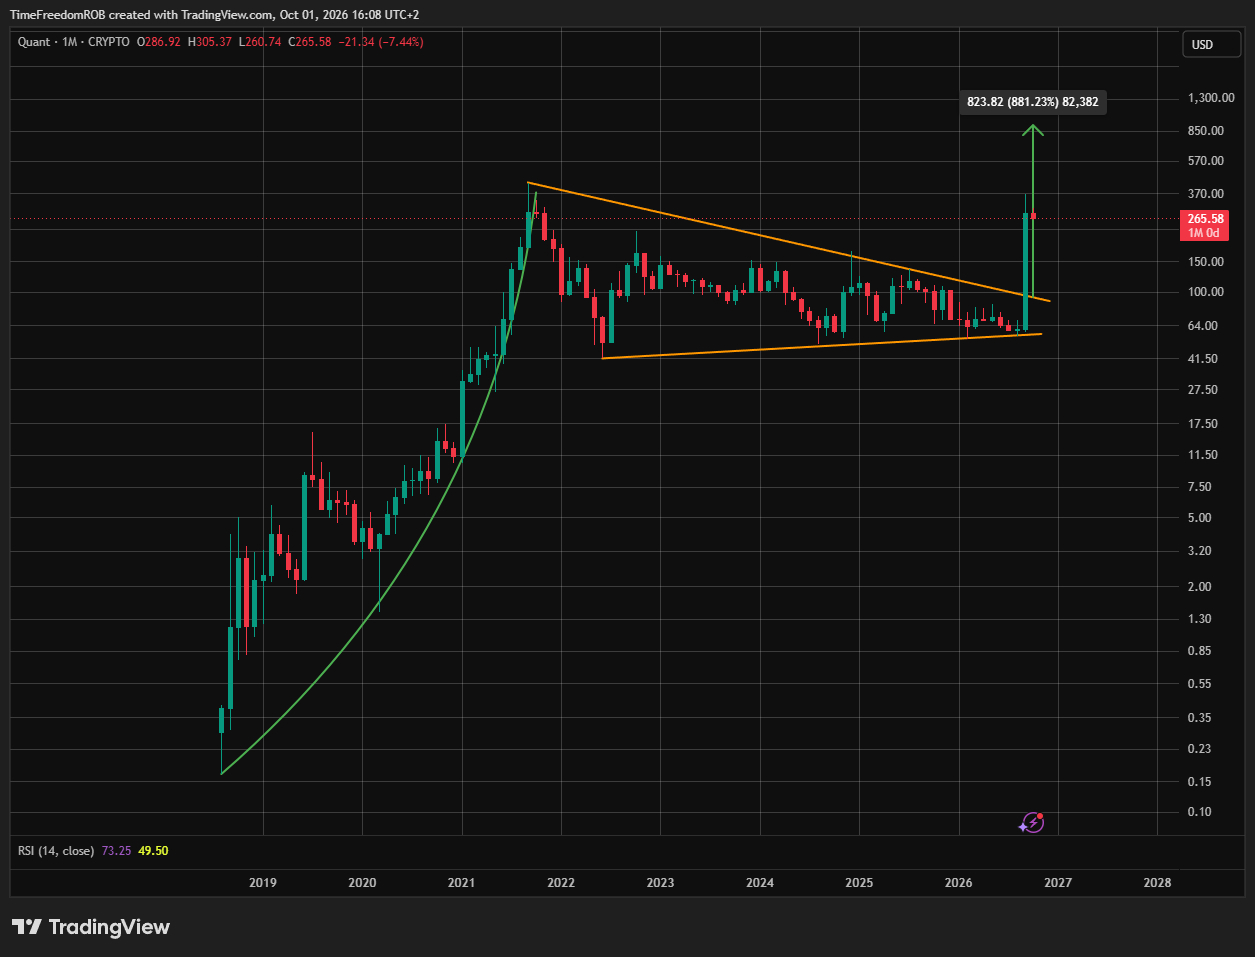
Most still treat $QNT like another 2018 leftover that never woke up.
They skipped the chapter where it listed into a graveyard, printed $0.16, then they burned millions of unsold tokens and left only 14.6M standing.
Years of looking dead.
Now it’s gone parabolic over $300.
That’s not a random green candle.
That’s what happens when forgotten supply finally meets a bid.
We all know what happens next.
.
claim 🎁🎁🎁🎁👈
.
claim 2, 🎁🎁🎁🎁👈
.
Most still treat $QNT like another 2018 leftover that never woke up.
They skipped the chapter where it listed into a graveyard, printed $0.16, then they burned millions of unsold tokens and left only 14.6M standing.
Years of looking dead.
Now it’s gone parabolic over $300.
That’s not a random green candle.
That’s what happens when forgotten supply finally meets a bid.
We all know what happens next.


橙子Joyce
·
--
BullishThe Fed’s hawkish cry is back! U.S. Treasury yields surge—where will the stock market go next?
U.S. stocks ended Wednesday with mixed performance. Although cooler PCE data briefly boosted the broader market, as Fed officials collectively released “hawkish” signals, both Treasury yields and the U.S. dollar index strengthened, weighing again on equities.
🚨 Fed turns uniformly hawkish: Is rate hikes not at the end?
Kashkari (President of the Minneapolis Fed): Inflation is still about 3%, far above the 2% goal. The neutral interest rate may be higher than previously expected. He expects another rate hike this year and another in 2027. He also cautioned about risks of long-term supply shocks stemming from the situation in Iran.
Lisa Cook (Federal Reserve Board Governor): Inflation has been above target for more than five and a half years. She supports a 25-basis-point rate hike in September and emphasized how high energy and housing costs in rural areas squeeze household budgets.
Goolsbee (President of the Chicago Fed): He bluntly said that maintaining high inflation for a long time is “playing with fire.” Large fiscal deficits and market expectations of AI-driven productivity gains could both lead to the economy overheating.
📈 Market reaction: Treasury yields hit multi-year highs, and the dollar strengthens
Treasury yields leap higher: The intraday yield on the 10-year Treasury broke above 5.3%, while the 30-year rose to around 5.64%, both at the highest levels since 2002.
U.S. stocks whipsaw: The Dow fell by more than 440 points in a single day, and the S&P 500 closed lower. Only the Nasdaq ended higher against the trend, supported by technology stocks.
The dollar index holds firm: The dollar rose nearly 2% in September, posting its best monthly performance in half a year. The market has basically priced in a December rate hike. It is now expected that total tightening over the next 12 months will be about 90 basis points.
💡 Key observations and takeaways
1. Pressure on the transmission of borrowing costs: With 10- and 30-year Treasury yields serving as pricing anchors, their persistent surge is broadly lifting mortgage and corporate financing costs, creating clear drag on the real economy and equity valuations.
2. “Term premium” returns: Strong GDP data and the expansion of fiscal deficits have pushed investors to demand higher yields from long-term Treasuries. Safe-haven and high-yield Treasury assets have siphoned off some capital from parts of the crypto and equity markets.
#美联储会议
#币安广场
$NVDA.US
$SPCX.US
$AMZN.US
U.S. stocks ended Wednesday with mixed performance. Although cooler PCE data briefly boosted the broader market, as Fed officials collectively released “hawkish” signals, both Treasury yields and the U.S. dollar index strengthened, weighing again on equities.
🚨 Fed turns uniformly hawkish: Is rate hikes not at the end?
Kashkari (President of the Minneapolis Fed): Inflation is still about 3%, far above the 2% goal. The neutral interest rate may be higher than previously expected. He expects another rate hike this year and another in 2027. He also cautioned about risks of long-term supply shocks stemming from the situation in Iran.
Lisa Cook (Federal Reserve Board Governor): Inflation has been above target for more than five and a half years. She supports a 25-basis-point rate hike in September and emphasized how high energy and housing costs in rural areas squeeze household budgets.
Goolsbee (President of the Chicago Fed): He bluntly said that maintaining high inflation for a long time is “playing with fire.” Large fiscal deficits and market expectations of AI-driven productivity gains could both lead to the economy overheating.
📈 Market reaction: Treasury yields hit multi-year highs, and the dollar strengthens
Treasury yields leap higher: The intraday yield on the 10-year Treasury broke above 5.3%, while the 30-year rose to around 5.64%, both at the highest levels since 2002.
U.S. stocks whipsaw: The Dow fell by more than 440 points in a single day, and the S&P 500 closed lower. Only the Nasdaq ended higher against the trend, supported by technology stocks.
The dollar index holds firm: The dollar rose nearly 2% in September, posting its best monthly performance in half a year. The market has basically priced in a December rate hike. It is now expected that total tightening over the next 12 months will be about 90 basis points.
💡 Key observations and takeaways
1. Pressure on the transmission of borrowing costs: With 10- and 30-year Treasury yields serving as pricing anchors, their persistent surge is broadly lifting mortgage and corporate financing costs, creating clear drag on the real economy and equity valuations.
2. “Term premium” returns: Strong GDP data and the expansion of fiscal deficits have pushed investors to demand higher yields from long-term Treasuries. Safe-haven and high-yield Treasury assets have siphoned off some capital from parts of the crypto and equity markets.
#美联储会议
#币安广场
$NVDA.US
$SPCX.US
$AMZN.US


Bilverse
·
--
🚨 BILVERSEARMY — THE RED PACKET IS LIVE! 🔴🧧
We’re dropping a MASSIVE ETH GIVEAWAY for all the followers ⚡️💎
Claiming is simple:
1️⃣ Follow me
2️⃣ Like this post ❤️
3️⃣ Comment “ETH” below 👇
That’s it. You’re in! 🫡🔥
Let’s make some noise and show the world what #BilverseArmy is all about. 🚀
RED PACKET ACTIVATED. 🧧🔴 ETH LOADING…
#ETH #RedPacketMission #Bilverse #Giveaway
We’re dropping a MASSIVE ETH GIVEAWAY for all the followers ⚡️💎
Claiming is simple:
1️⃣ Follow me
2️⃣ Like this post ❤️
3️⃣ Comment “ETH” below 👇
That’s it. You’re in! 🫡🔥
Let’s make some noise and show the world what #BilverseArmy is all about. 🚀
RED PACKET ACTIVATED. 🧧🔴 ETH LOADING…
#ETH #RedPacketMission #Bilverse #Giveaway


aley-jutt-99
·
--
🔥 ETHEREUM IS MORE THAN JUST A COIN
When people hear Ethereum, they often think about $ETH and its price. 💰
But Ethereum is much bigger than that. 👀
🌐 A platform for Web3
🤖 Smart contracts can run automatically without a traditional middleman.
💎 DeFi applications are built on Ethereum.
🎨 NFTs and digital assets have used its network.
🏗️ Thousands of developers continue building on its ecosystem.
And that’s what makes Ethereum interesting —$ETH isn’t only something people trade; it also powers activity across a large blockchain ecosystem.
The real question isn’t just:
“Where will $ETH ’s price go?” 📈
It’s also:
“How much of the future digital economy will be built on Ethereum?” 🚀
DYOR. Learn first. Trade responsibly.
#Ethereum #Crypto #Binance #Web3 #Blockchain
When people hear Ethereum, they often think about $ETH and its price. 💰
But Ethereum is much bigger than that. 👀
🌐 A platform for Web3
🤖 Smart contracts can run automatically without a traditional middleman.
💎 DeFi applications are built on Ethereum.
🎨 NFTs and digital assets have used its network.
🏗️ Thousands of developers continue building on its ecosystem.
And that’s what makes Ethereum interesting —$ETH isn’t only something people trade; it also powers activity across a large blockchain ecosystem.
The real question isn’t just:
“Where will $ETH ’s price go?” 📈
It’s also:
“How much of the future digital economy will be built on Ethereum?” 🚀
DYOR. Learn first. Trade responsibly.
#Ethereum #Crypto #Binance #Web3 #Blockchain


TradeMaster_PK
·
--
BullishReceived USDT Rewards Gift 🎁🎁🎁🎁🎁🎁🎁🧧🧧🧧🧧🧧🎁🎁🎁🎁
1 follow me
2 like
3 repos
#Ether ETFs extend inflow streak today
#USStrikesTargetsNearHormuzAndJask
1 follow me
2 like
3 repos
#Ether ETFs extend inflow streak today
#USStrikesTargetsNearHormuzAndJask


king Gulfam
·
--
Bullish#EarningsSeason
@ZEC @BNC @NEAR
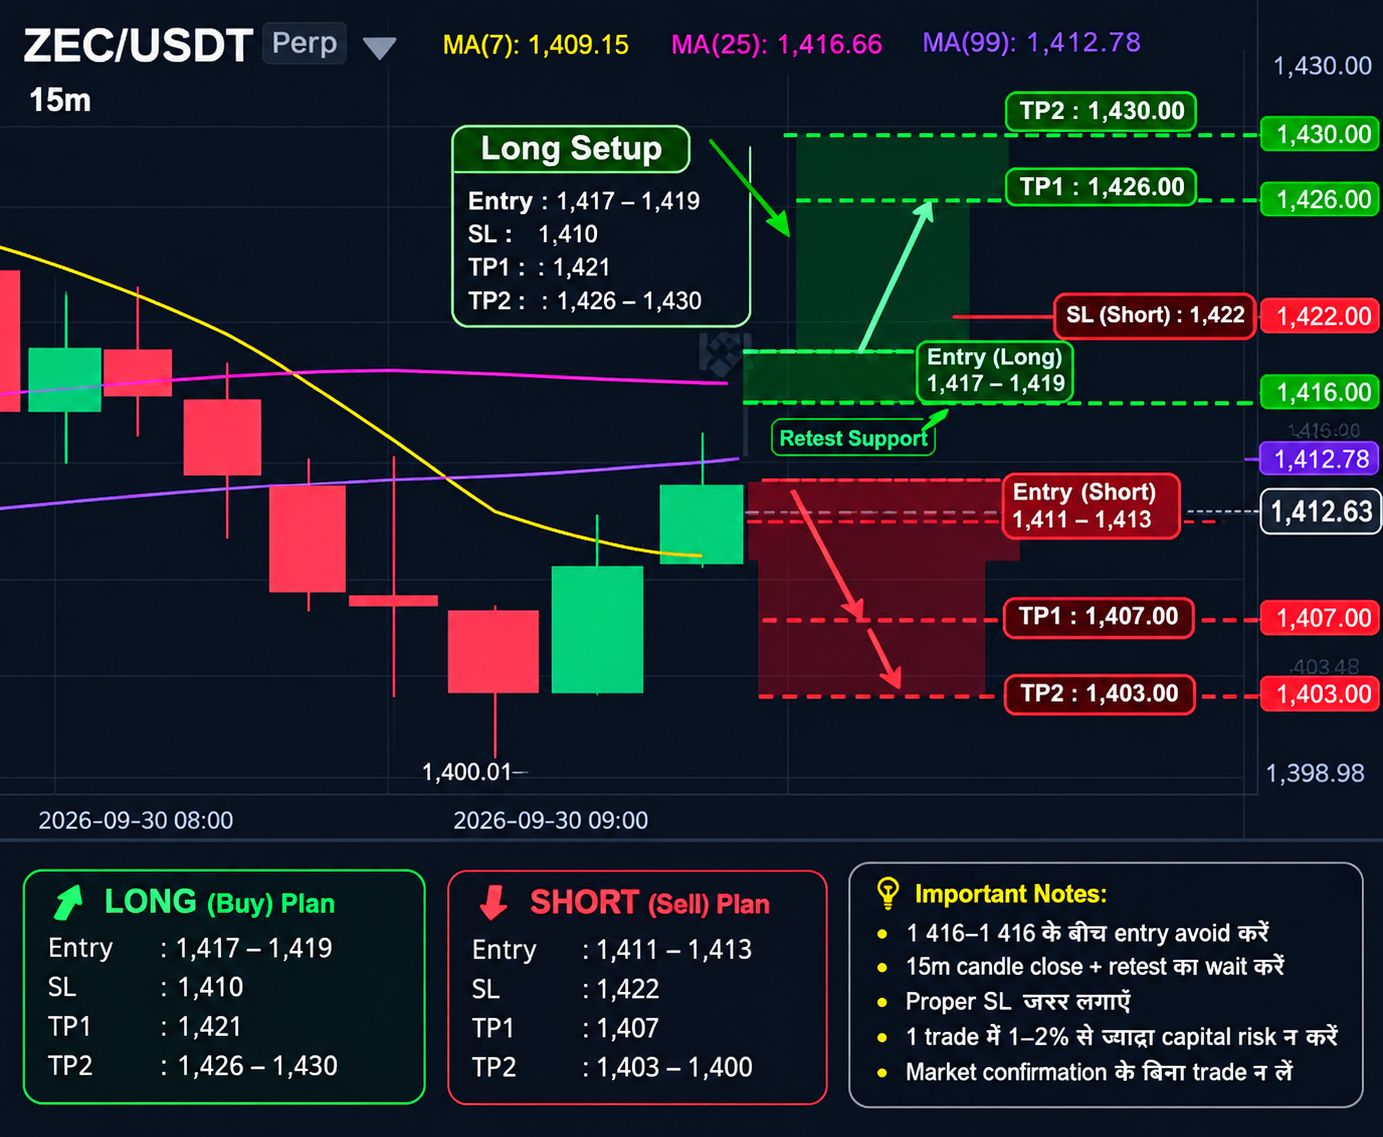
$ZEC
🟢 Long setup:
If we get a close above 1416.7 on the 15m candle and it holds on retest →
Entry: 1417–1419
SL: 1410
TP1: 1421
TP2: 1426–1430
🔴 Short setup:
If we see a strong rejection from the 1416–1421 zone and price closes below 1412 →
Entry: 1411–1413
SL: 1422
TP1: 1407
TP2: 1403–1400
Right now, it’s better to avoid entries between 1412–1416 because price is trapped between moving averages.
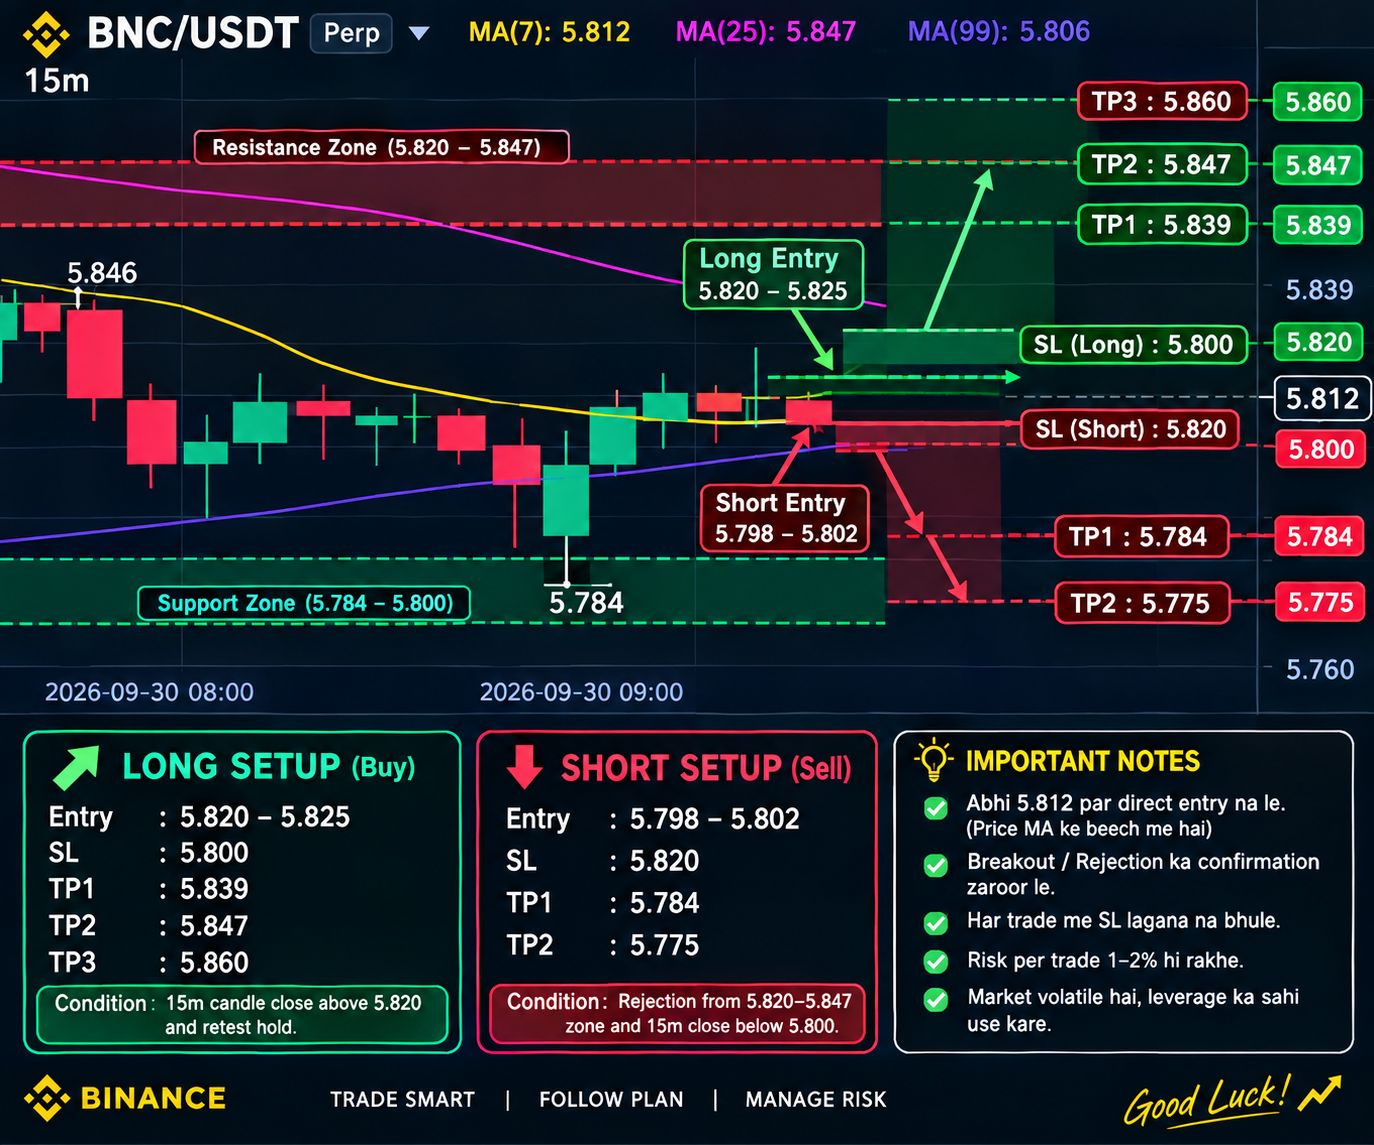
$BNC
🟢 LONG — after confirmation
If the 15m candle closes above 5.820 and holds on retest:
Entry: 5.820–5.825
SL: 5.800
TP1: 5.839
TP2: 5.847
TP3: 5.860
🔴 SHORT — after rejection
If we get rejection from the 5.820–5.847 zone and price closes 15m below 5.800:
Entry: 5.798–5.802
SL: 5.820
TP1: 5.784
TP2: 5.775
$NEAR
LONG setup:
15m candle closes above 5.00 + retest
SL: 4.94
TP1: 5.03
TP2: 5.08–5.12
SHORT setup:
If we get strong rejection from 4.98–5.00
Entry: 4.96–4.98
SL: 5.04
TP1: 4.93
TP2: 4.89
@ZEC @BNC @NEAR
$ZEC
🟢 Long setup:
If we get a close above 1416.7 on the 15m candle and it holds on retest →
Entry: 1417–1419
SL: 1410
TP1: 1421
TP2: 1426–1430
🔴 Short setup:
If we see a strong rejection from the 1416–1421 zone and price closes below 1412 →
Entry: 1411–1413
SL: 1422
TP1: 1407
TP2: 1403–1400
Right now, it’s better to avoid entries between 1412–1416 because price is trapped between moving averages.
$BNC
🟢 LONG — after confirmation
If the 15m candle closes above 5.820 and holds on retest:
Entry: 5.820–5.825
SL: 5.800
TP1: 5.839
TP2: 5.847
TP3: 5.860
🔴 SHORT — after rejection
If we get rejection from the 5.820–5.847 zone and price closes 15m below 5.800:
Entry: 5.798–5.802
SL: 5.820
TP1: 5.784
TP2: 5.775
$NEAR
LONG setup:
15m candle closes above 5.00 + retest
SL: 4.94
TP1: 5.03
TP2: 5.08–5.12
SHORT setup:
If we get strong rejection from 4.98–5.00
Entry: 4.96–4.98
SL: 5.04
TP1: 4.93
TP2: 4.89

WOLF 狼
·
--
BullishAlert Claim BNB Reward Fast Claim 🎉 🧧
The yellow check mark is officially back after 2 months today is a double win because of all of you.🎉
Two months is a long time to wait, but patience always pays off. Having the yellow check mark back today has me feeling pumped up and ready for what's next.⚡️🔥
Success is always better when it's shared. To celebrate today's incredible vibe, a reward is waiting for you all! Grab yours before it runs out.✨
Go claim your red packet now and celebrate with the family.🧧🎁
$BNB
The yellow check mark is officially back after 2 months today is a double win because of all of you.🎉
Two months is a long time to wait, but patience always pays off. Having the yellow check mark back today has me feeling pumped up and ready for what's next.⚡️🔥
Success is always better when it's shared. To celebrate today's incredible vibe, a reward is waiting for you all! Grab yours before it runs out.✨
Go claim your red packet now and celebrate with the family.🧧🎁
$BNB


奕泽YIZZE
·
--
Follow, like, and share to get a red envelope🧧🧧🧧🧧
Follow, like, and share to claim your red envelope!🧧🧧🧧🧧
LUCiC, value begins with consensus; the future begins with persistence.
Follow, like, and share to claim your red envelope!🧧🧧🧧🧧
LUCiC, value begins with consensus; the future begins with persistence.


Sara_ k
·
--
.
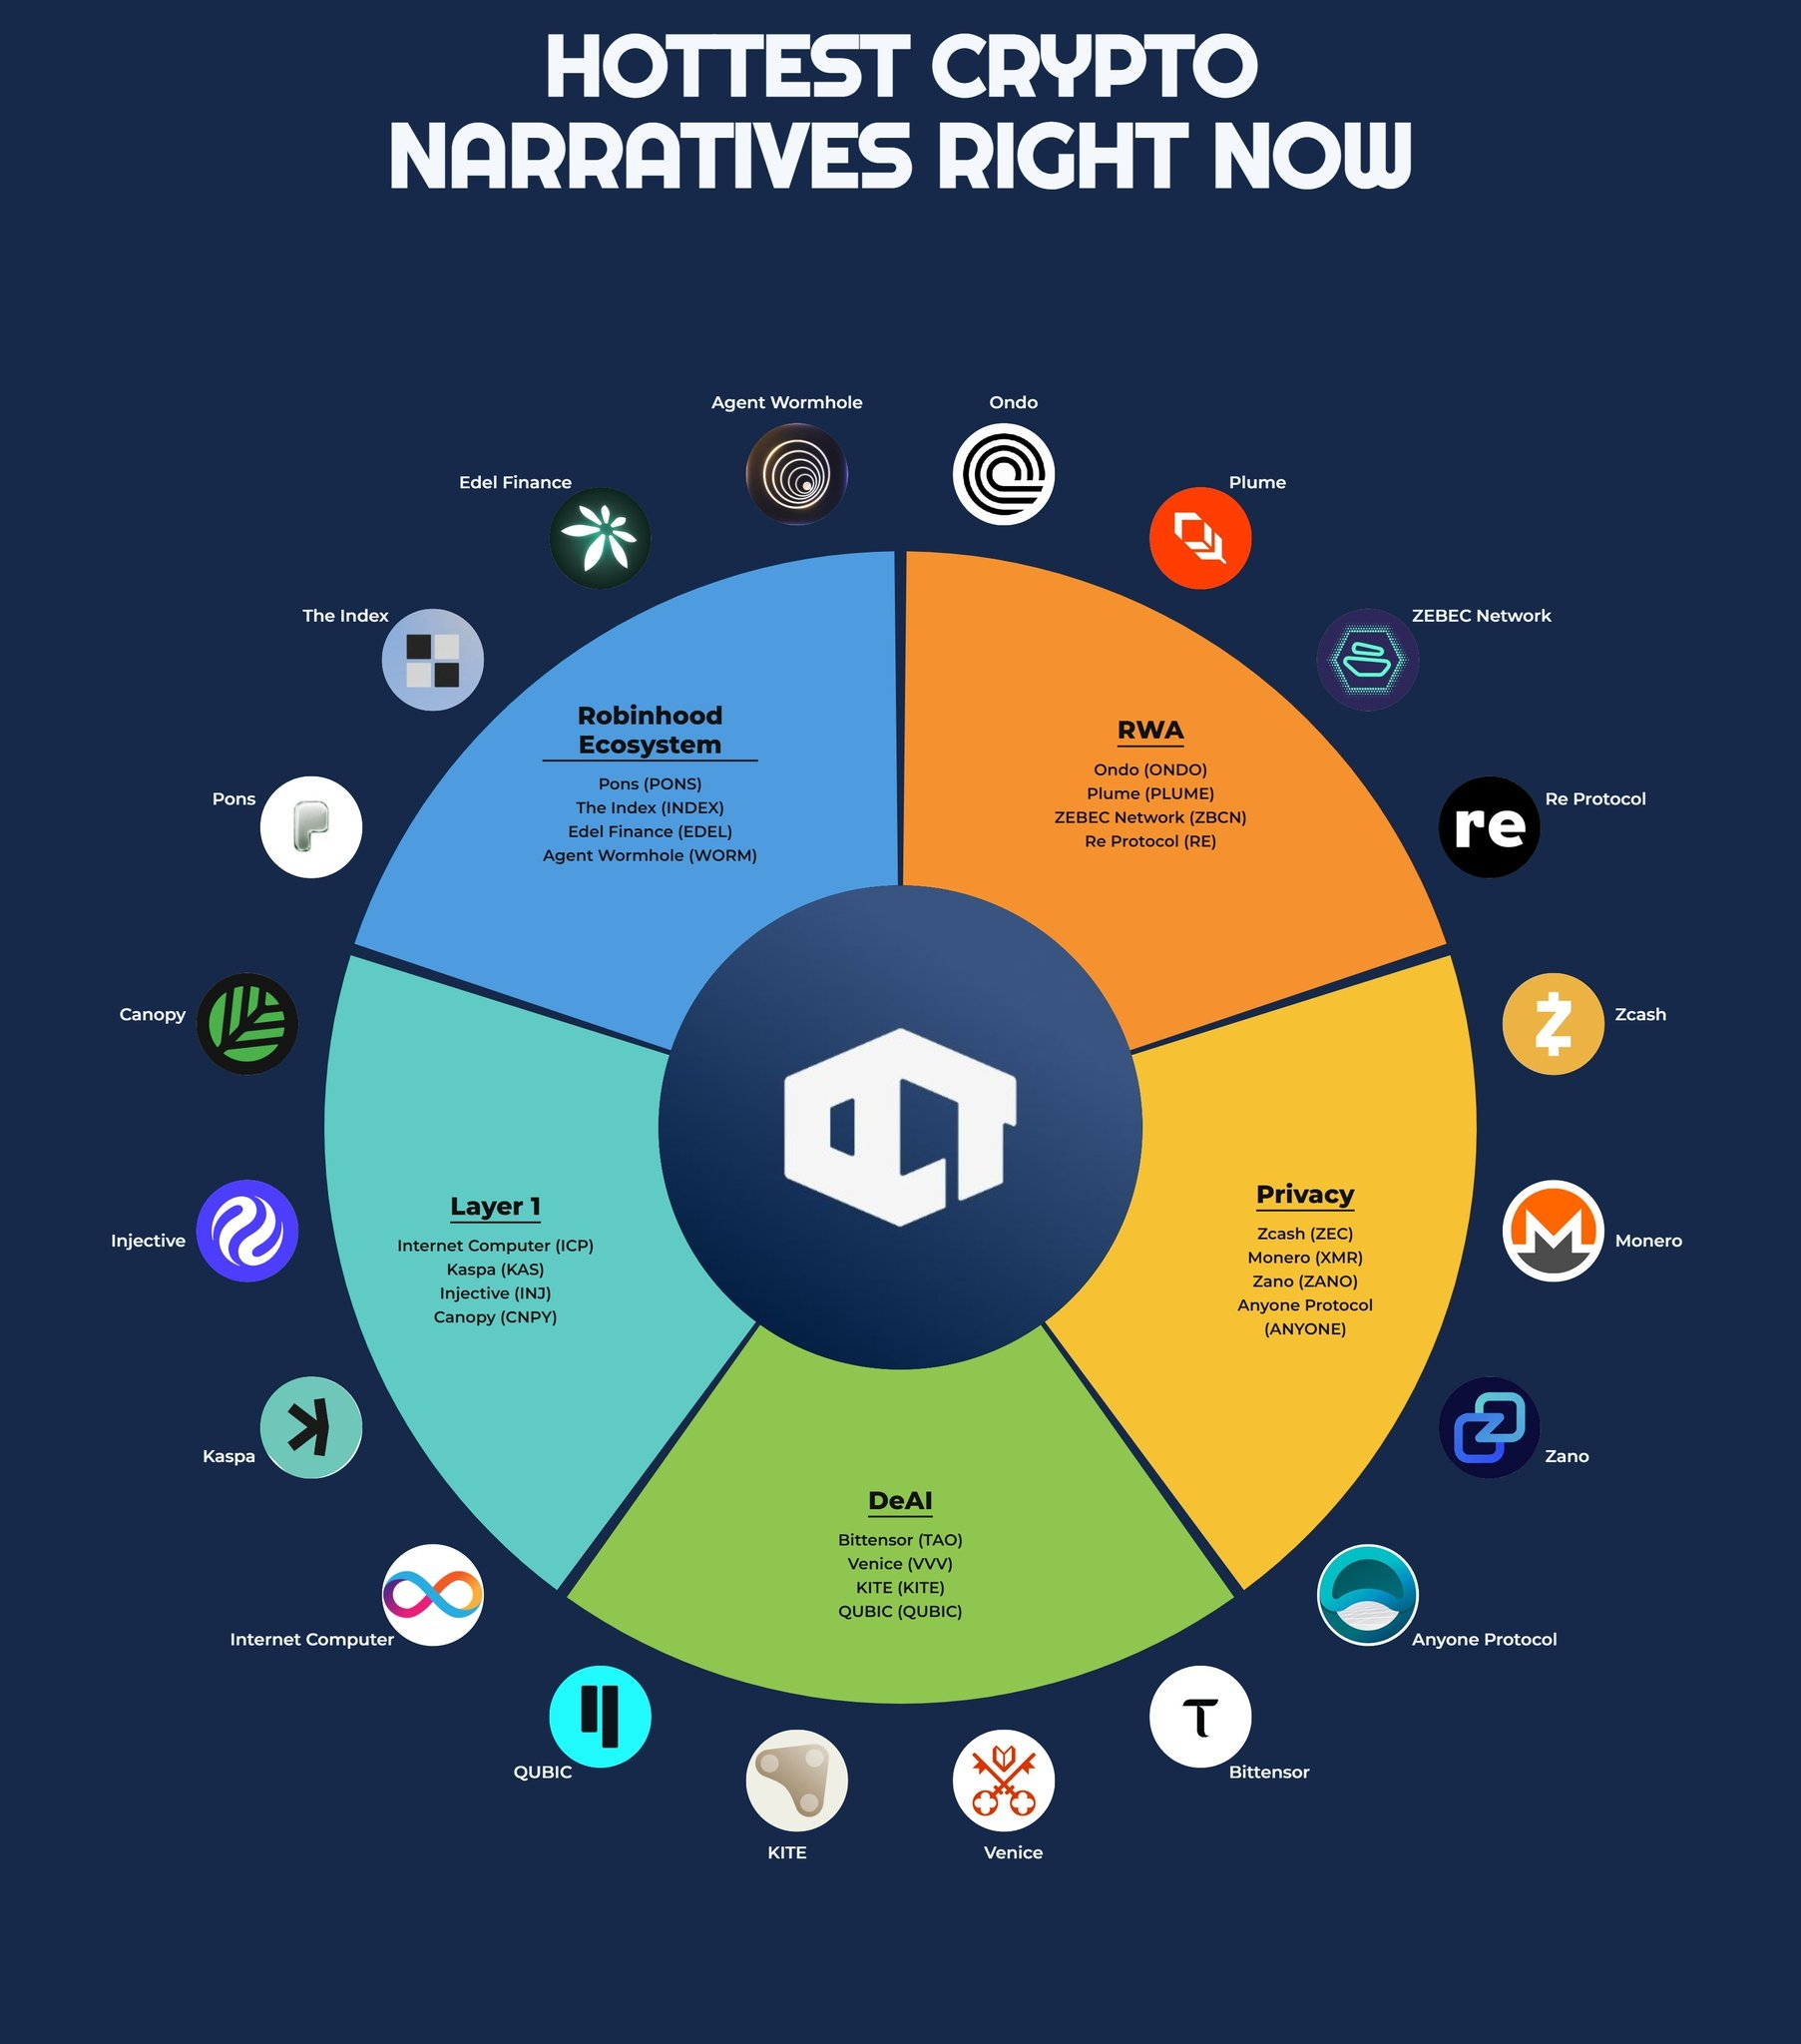
HOTTEST CRYPTO NARRATIVES RIGHT NOW
.
claim 🎁🧧🧧🧧👈
.
claim 2 🧧🧧🧧🧧🧧👈
.
$ZEC $QNT $XMR
HOTTEST CRYPTO NARRATIVES RIGHT NOW
.
claim 🎁🧧🧧🧧👈
.
claim 2 🧧🧧🧧🧧🧧👈
.
$ZEC $QNT $XMR

@大丽7613
is speaking[LIVE] 🎙️ Together: Real-World Trading SGY On-Chain Singularity AMA
7.7k listens

奋斗Hustle1688
·
--
Wishing everyone a happy National Day and big money—take a break today.


周周1688
·
--
🇨🇳 October 1|Crypto Market Brief
$BNB 🧧
🎬 With Q4 starting off, there’s no “Uptober”—the market begins pricing in risks first
BTC is currently around $83.4–84.3K, ETH around $2.7K, SOL around $119.
Yesterday’s PCE data came in below expectations: Headline 3.4% YoY, Core 3.0%.
BTC briefly surged to $85.5K, but then pulled back to around $84K. Elevated U.S. Treasury yields continue to weigh on risk assets.
🔴 Nine straight days of ETF gains end
September 30: BTC ETF −$148.7M, ETH ETF −$59.6M, SOL ETF −$12.5M
Total: about −$221M.
Strong inflows have cooled temporarily, but it’s not yet enough to suggest the institutional trend has reversed.
🏛 CFTC eyes prediction markets
The CFTC submitted two draft rule proposals to OIRA, covering event contracts and their regulatory scope.
The key question is straightforward: for prediction markets like Kalshi and Polymarket, should regulation fall under the federal CFTC or state-level regulators?
For now, it’s only in the rulemaking stage—not the final rules.
⚠️ MetaMask pauses some validators
After detecting a security incident affecting infrastructure, MetaMask began exiting some impacted Ethereum staking validators.
No direct threats to users’ wallets have been found at this time. The company is treating the related actions as a precaution.
💥 Gate encounters a BEN trading error
Due to ticker confusion from the same token name, Gate mishandled BENUSDT perpetual funding-related adjustments, impacting about 200 accounts.
Gate says it will restore the related balances and take responsibility for the losses caused by the incident.
📊 Market Snapshot
BTC ≈ $83.4–84.3K
ETH ≈ $2.68–2.72K
SOL ≈ $118–119
BTC Dominance ≈ 58%
Fear & Greed ≈ 68–74
🎯 On the first day of October, the market is waiting for a new direction.
PCE has given interest-rate-cut expectations a bit of room, but ETF flows have cooled temporarily, and Treasury yields remain elevated.
And tomorrow, the market will shift its focus to U.S. nonfarm payroll employment data.
Q4 has just begun.
#1688家族family #crypto #RWA赛道 #defi $MOVR
$BNB 🧧
🎬 With Q4 starting off, there’s no “Uptober”—the market begins pricing in risks first
BTC is currently around $83.4–84.3K, ETH around $2.7K, SOL around $119.
Yesterday’s PCE data came in below expectations: Headline 3.4% YoY, Core 3.0%.
BTC briefly surged to $85.5K, but then pulled back to around $84K. Elevated U.S. Treasury yields continue to weigh on risk assets.
🔴 Nine straight days of ETF gains end
September 30: BTC ETF −$148.7M, ETH ETF −$59.6M, SOL ETF −$12.5M
Total: about −$221M.
Strong inflows have cooled temporarily, but it’s not yet enough to suggest the institutional trend has reversed.
🏛 CFTC eyes prediction markets
The CFTC submitted two draft rule proposals to OIRA, covering event contracts and their regulatory scope.
The key question is straightforward: for prediction markets like Kalshi and Polymarket, should regulation fall under the federal CFTC or state-level regulators?
For now, it’s only in the rulemaking stage—not the final rules.
⚠️ MetaMask pauses some validators
After detecting a security incident affecting infrastructure, MetaMask began exiting some impacted Ethereum staking validators.
No direct threats to users’ wallets have been found at this time. The company is treating the related actions as a precaution.
💥 Gate encounters a BEN trading error
Due to ticker confusion from the same token name, Gate mishandled BENUSDT perpetual funding-related adjustments, impacting about 200 accounts.
Gate says it will restore the related balances and take responsibility for the losses caused by the incident.
📊 Market Snapshot
BTC ≈ $83.4–84.3K
ETH ≈ $2.68–2.72K
SOL ≈ $118–119
BTC Dominance ≈ 58%
Fear & Greed ≈ 68–74
🎯 On the first day of October, the market is waiting for a new direction.
PCE has given interest-rate-cut expectations a bit of room, but ETF flows have cooled temporarily, and Treasury yields remain elevated.
And tomorrow, the market will shift its focus to U.S. nonfarm payroll employment data.
Q4 has just begun.
#1688家族family #crypto #RWA赛道 #defi $MOVR

Log in to explore more content