

Gold collapsed today.
At Beijing time 0:00, it was still at 4,283.95.
It hit a low of 4,116.60.
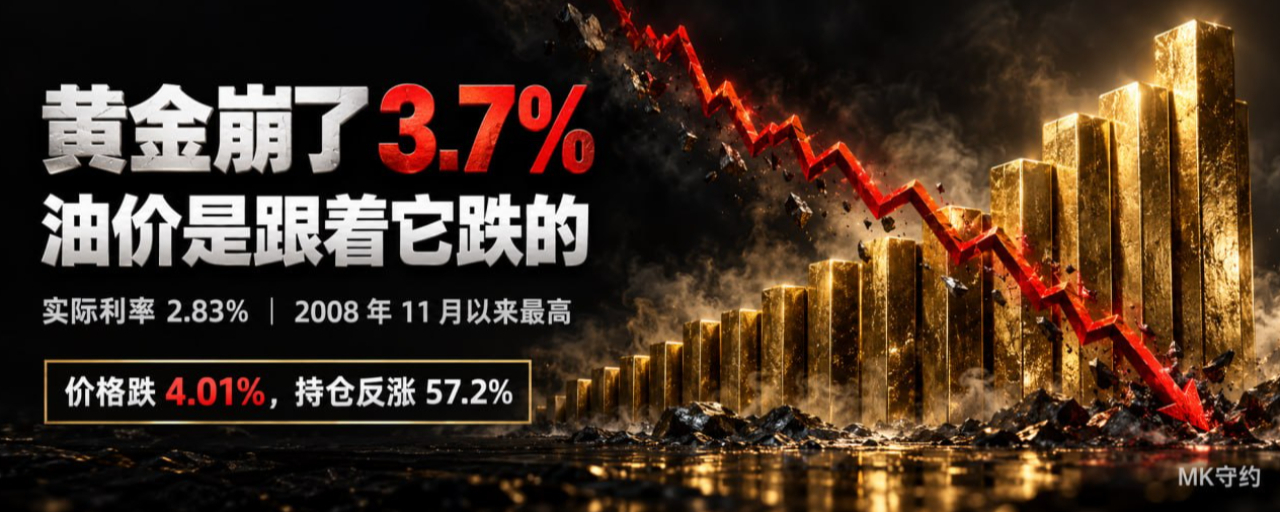
Starting from the intraday high of 4,288.39, it fell as much as 4.01%.
This is the lowest point since August 5.
Now when you look up “why gold is falling,” the answer is basically the same.
The rise in oil prices lifted inflation concerns, and the Fed still needs to raise rates, so gold was dragged down.
That explanation sounds especially smooth.
But it has a problem with the sequence of events.
I put today’s oil price and gold price side by side hour by hour.
Oil didn’t fall along with gold—it fell because of gold.
From midnight Beijing time to 12:00, Brent’s closing price hovered between $98.25 and $99.10, with almost no direction.
At the same time, gold was already falling from 4,283.95 to 4,199.37, down 1.97%.
The first time Brent touched $100 was at 16:00 in the afternoon.
And within that hour, it briefly topped out at 100.75.
But at that moment, gold was already down to 4,150.12, a 3.12% drop from 0:00.
In other words, most of the gold selloff finished first, and only then did oil start moving.
You can’t use a variable that only kicks in after 16 points,
To explain a collapse that started at 6 a.m. and never stopped.
So what’s the real driver? This drop today has three layers.
First layer: it’s not the rate hike itself, but the expectation that “there will be another hike in October.”
First, lay out the background.
On Sep 16, the Fed raised the policy rate by 25 basis points to 3.75%–4.00%.
The whole room voted unanimously; this is the first rate hike since 2023.
But there’s one detail many people didn’t notice.
On the day of the rate hike, gold’s close fell only 0.26%; the next day it rose 1.75%; and on the third day it rose again by 0.72%.
The rate hike itself didn’t push gold down.
The real problem lies in the past week.
At the start of last week, the market’s pricing for a rate hike in October was about 55%.
By last weekend, that probability had been pushed to around 70%.
What happened in the middle? A handful of Fed officials turned hawkish in succession.
Cleveland Fed Chair Hammack emphasized that inflation risks remain high and policy must stay restrictive.
Governor Barr also said further policy adjustments are needed.
Barkin and Collins both support this rate hike.
From 55% to 70%—that’s the new information.
Second layer: the real driver is real yields—they’ve climbed to the highest level since Nov 2008.
That “rate hike in October” — through what channel was it pushed down into the gold price?
The answer is real yields.
The U.S. 10-year Treasury’s real yield,
It’s the return investors really get after subtracting inflation.
On Sep 25, it was 2.83%.
How high is that number? I went to check the U.S. Treasury’s complete daily data from 2003 to today.
The last time we saw this level was on November 24, 2008, when it was 3.11%.
Nearly 18 years.
Over the same period, the nominal 10-year yield was 5.17%.
The last time it was this high was July 2007.
Take out the real from the nominal, and what’s left is the market-implied inflation expectation. On Sep 25, it was 2.34%.
Now look three days ago.
On Sep 22, the nominal figure was 4.96%, but in reality it was 2.63%, implying inflation of 2.33%.
In three days, nominal yields rose by 21 basis points.
Of which 20 basis points came from real yields, and inflation expectations contributed only 1 basis point.
These words are worth reading twice.
Over the past week, almost everything that suppressed gold was “real returns rising,” and it has virtually nothing to do with “inflation coming back.”
Gold doesn’t pay interest.
If you hold gold, the only thing you give up is the risk-free real return.
The “thing you gave up” is now at the highest level since 2008.
So gold doesn’t need any new bad news at all. As long as a risk-free asset can give you more real return, gold will just keep sliding on its own.
Third layer: what’s really worth watching today is the opposite actions of big accounts and retail accounts.
The first two layers explain why gold is under pressure.
But today, what makes me most alert is positioning.
Binance XAU/USDT perpetual open interest: at 23:00 last night, it was 109,954 contracts.
Tonight at 23:00: 172,833 contracts, up 57.2% over the past 24 hours.
Prices are collapsing, while positions are surging higher.
This shows today isn’t longs admitting defeat and exiting. If it were an exit,
Open interest should be declining.
So what direction is the newly opened positions taking?
Look at two sets of long-position ratios—both are the same window from 8:00 this morning to 23:00 tonight.
By position size, big accounts’ share of longs fell from 75.15% to 70.31%.
And by number of accounts, the share of long accounts rose from 85.37% to 89.62%.
These two numbers move in opposite directions, and the meaning is very specific.
Accounts with heavier positions are reducing longs;
The group with lots of accounts but small size is adding to longs.
Next, look at the funding rate.
Before 8:00 today it was 0; after 8:00 it turned positive.
At noon it briefly reached +0.0158%, and before the close it was still at +0.0127%.
A positive funding rate means longs are paying shorts.
Down 3.7%: big accounts reduce longs,
Small accounts add longs; longs are still paying money backward.
In the futures market, this combination has a not-so-nice name.
The bag-holder.
A healthy bottom should have three things.
A batch of longs were liquidated; open interest dropped, and the funding rate turned negative.
Now none of the three has shown up, and the first two are completely the opposite.
Also take a quick look at silver—it's a confirmation that the pressure is still transmitting downward.
Using the same basis, silver perpetuals fell from 64.14 at 0:00 to a low of 60.80.
Down 5.21%, clearly deeper than gold’s 3.91% drop from 0:00.
Silver has more leverage in that precious-metals chain.
It fell even harder, indicating that the entire chain is being repriced.
It’s not that gold alone produced any bearish surprise.
So what should we watch next?
First, shift attention away from oil prices—what happened today is lagged.
What truly determines gold’s direction is the U.S. August core PCE released at 20:30 on Sep 30.
With a slight bullish tilt, real yields still have room to move higher, so the suppression isn’t over.
Only when it clearly weakens will the market cut its rate-hike expectations, and only then can real rates peak.
Second, watch real yields—don’t focus on inflation.
This week’s inflation expectations moved only 1 basis point—it isn’t part of this repricing at all.
Waiting for inflation to come back is useless.
If the 10-year real yield doesn’t fall from 2.83%, gold’s pressure won’t go away.
Third, put open interest and the funding rate on your watchlist.
Today, open interest is up 57.2% and the rate is still positive.
Both are signals that the longs haven’t been fully liquidated yet.
Only when open interest clearly drops while the funding rate turns negative—that’s when the leverage is truly being cleared.
That’s when talking about “having dropped enough and bottomed out” makes sense.
One last thing, possibly uncomfortable to hear.
Since the Jan 28 high of 5,625.34, gold has fallen 26.8%.
Throughout this process, every time it fell, someone told you, “It has dropped enough,” “It’s time to bounce,” “The long-term logic hasn’t changed.”
These words might have been right a year ago.
But as long as you have positions, leverage, and time costs in your hands, what truly determines your outcome isn’t the long-term logic.
It’s not about gold—it’s whether you can hold through the middle stretch.
Today’s data shows: big accounts are reducing, small accounts are adding, and positions are still piling up.
I hope you’ll honestly ask yourself one question.
Among the people added today, is any of them you?
—MK keeps the promise