
🚨 What’s happening to $XLM ? Will the rally continue, or has a correction become closer?
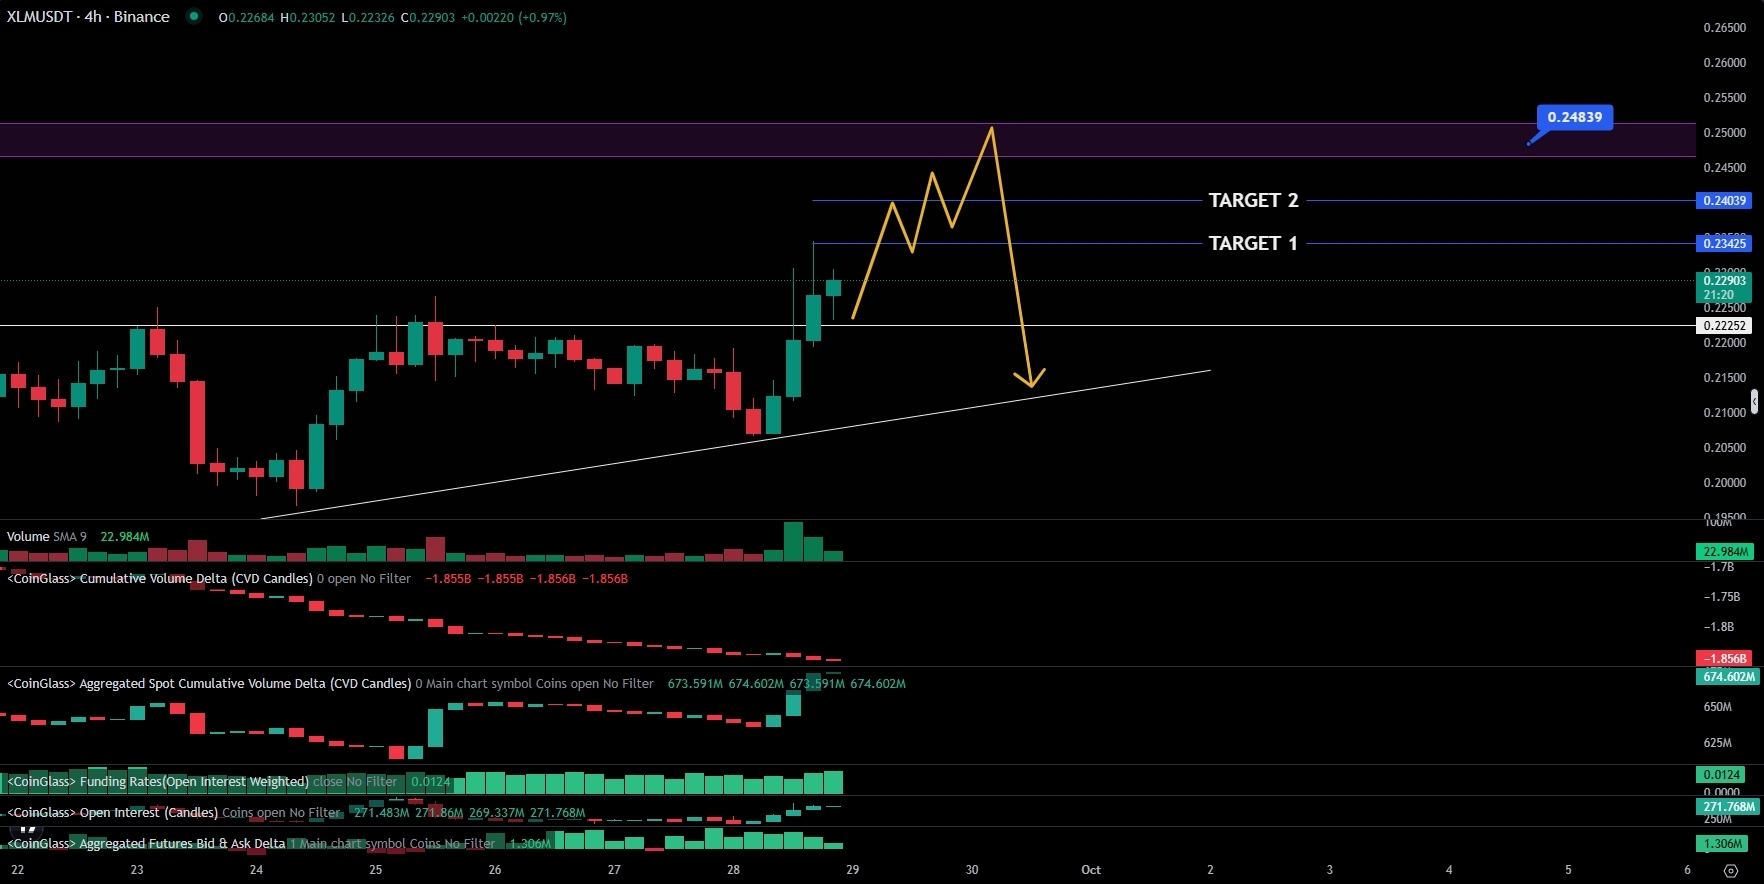
XLM has broken the descending trendline and is now trading above it, continuing to form new highs. But despite the strength in price action, futures data and liquidity indicate that the rally has become propped up by a high lever.
📊 Open Interest reached $270.68M with a positive Funding Rate, meaning leveraged long positions are increasing and the likelihood of a Long Squeeze rises on any reversal.
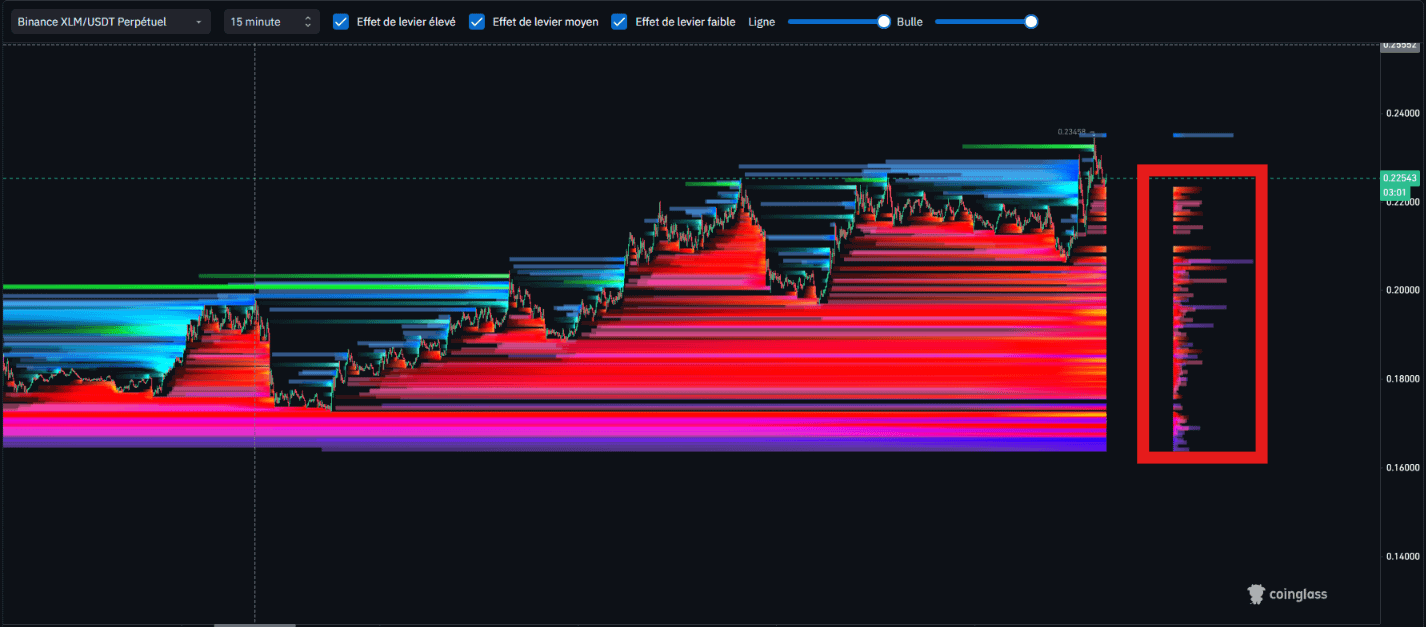
Meanwhile, the liquidity map shows large liquidity pools below the price, especially around $0.2100 and then $0.1900.
🎯 Therefore, the upside may continue first toward $0.2400–$0.2500 to collect liquidity above the peak.
⚠️ The scenario I’m watching: if the price reaches $0.2400–$0.2500 and a clear rejection appears there, the corrective wave could begin toward $0.2100 and then $0.1900.
So don’t rush to enter from current levels; wait for the price to reach the $0.2350–$0.2400 area. A rejection there will be an important signal for the start of the correction.
XLM has broken the descending trendline and is now trading above it, continuing to form new highs. But despite the strength in price action, futures data and liquidity indicate that the rally has become propped up by a high lever.
📊 Open Interest reached $270.68M with a positive Funding Rate, meaning leveraged long positions are increasing and the likelihood of a Long Squeeze rises on any reversal.
Meanwhile, the liquidity map shows large liquidity pools below the price, especially around $0.2100 and then $0.1900.
🎯 Therefore, the upside may continue first toward $0.2400–$0.2500 to collect liquidity above the peak.
⚠️ The scenario I’m watching: if the price reaches $0.2400–$0.2500 and a clear rejection appears there, the corrective wave could begin toward $0.2100 and then $0.1900.
So don’t rush to enter from current levels; wait for the price to reach the $0.2350–$0.2400 area. A rejection there will be an important signal for the start of the correction.