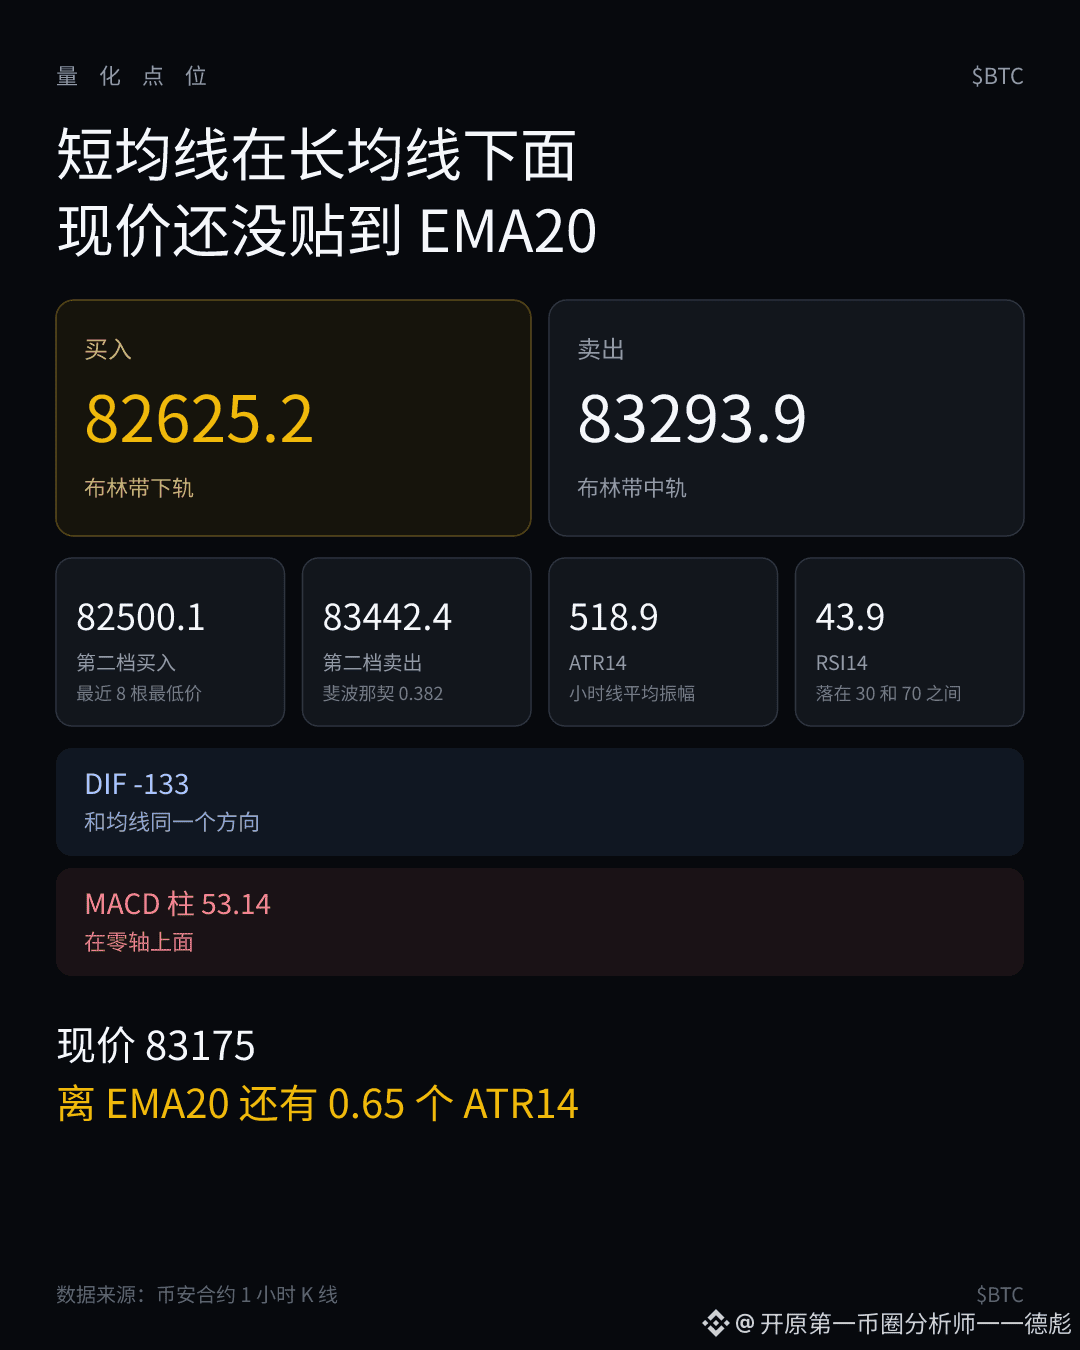
$BTC Current price 83175; on the hourly chart, first look to buy closer.
- Sell 83293.9
- Sell 83442.4
- Buy 82625.2
- Buy 82500.1
Latest news:
PANews: glassnode: spot traders are shifting to altcoins; trading volume is now close to 4x that of BTC
PANews: BTC breaks $84,000; intraday gain 0.80%
Decrypt: Strive Buys $94.5 Million in Bitcoin, Pushing Holdings Past 27,000 BTC
Moving averages. The short moving average is below the long moving average; the current price is still 0.65 ATR14 away from the EMA20, and it hasn’t touched yet.
The nearer buy is the lower band of the Bollinger Bands; the next buy is the lowest price of the most recent 8 hourly candles.
The nearer sell is the middle band of the Bollinger Bands; the farther sell is the Fibonacci 0.382 retracement of the past 24 hourly candles.
The long moving average, EMA60, is at 83790.2, and it is still above the two sell targets.
Momentum. Same direction as the moving averages. MACD’s DIF is -133, below the zero line. The histogram is 53.14, and it has returned above the zero line first. This is a pullback/relief rebound; the direction is still looking at DIF.
Volatility. The average swing of these hourly candles is ATR14 518.9.
#BTC
- Sell 83293.9
- Sell 83442.4
- Buy 82625.2
- Buy 82500.1
Latest news:
PANews: glassnode: spot traders are shifting to altcoins; trading volume is now close to 4x that of BTC
PANews: BTC breaks $84,000; intraday gain 0.80%
Decrypt: Strive Buys $94.5 Million in Bitcoin, Pushing Holdings Past 27,000 BTC
Moving averages. The short moving average is below the long moving average; the current price is still 0.65 ATR14 away from the EMA20, and it hasn’t touched yet.
The nearer buy is the lower band of the Bollinger Bands; the next buy is the lowest price of the most recent 8 hourly candles.
The nearer sell is the middle band of the Bollinger Bands; the farther sell is the Fibonacci 0.382 retracement of the past 24 hourly candles.
The long moving average, EMA60, is at 83790.2, and it is still above the two sell targets.
Momentum. Same direction as the moving averages. MACD’s DIF is -133, below the zero line. The histogram is 53.14, and it has returned above the zero line first. This is a pullback/relief rebound; the direction is still looking at DIF.
Volatility. The average swing of these hourly candles is ATR14 518.9.
#BTC