



28 September 2026 | Latest data available during today’s session
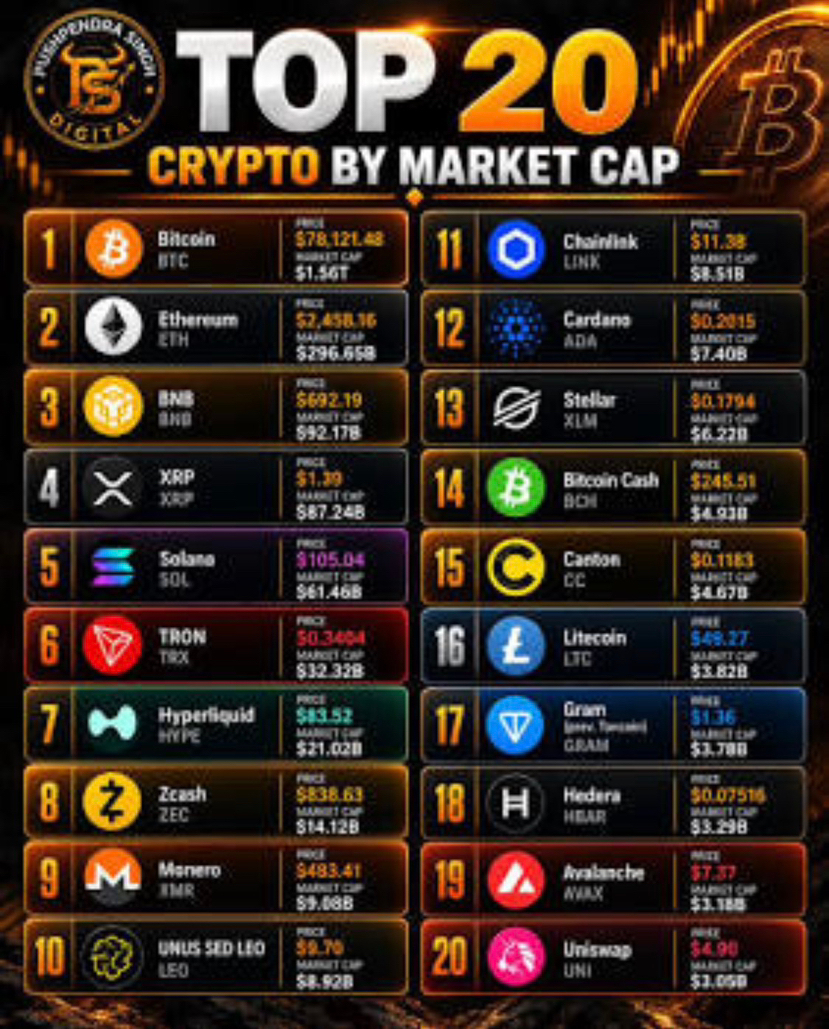
Methodological note: Prices and derivatives data change instantly and across platforms. Therefore, I use the most recent and reliable snapshots available, and I distinguish between real-time data and closed daily data. The levels below are analytical scenarios and not a guarantee of price movement.
1. 🔥 Main headline
The market is between correction and retest—institutional liquidity is positive, but resistance is applying pressure
Today the market saw a Risk-Off wave; total market cap fell by about 2% to roughly $2.9T, with rising oil pressure, US yields, and leveraged liquidations.
On the other hand, the institutional picture is different: US spot Bitcoin funds recorded +$2.39B during the week of Sep 21–25, while Ethereum funds posted about +$689.9M.
⸻
2. 🧭 Market Sentiment
Indicator Current reading
Total market cap ≈ $2.87–2.90T
BTC Dominance ≈58%
Fear & Greed Greed, around 70–74
Weekly BTC ETF +$2.39B
Weekly ETH ETF +$689.9M
Total Open Interest for perpetuals ≈$119.7B
There is also a slight discrepancy between data providers in the Fear & Greed value; Alternative.me shows 71 = Greed, while other market sources recorded 74 during the day.
Summary: Institutional flows are still supportive, but price isn’t moving with the same strength as the flows. This is important: having ETF inflows doesn’t automatically mean a fast continuation of the rally.
⸻
3. ₿ Bitcoin — BTC
Reference price: about $83,800–$84,000, with slight differences by platform. One of the latest snapshots put BTC at $83,892, while other snapshots were around $84K.
Trend
Frame Reading
Daily 🟢 Bullish, but correcting from the $87K area
4H 🟡 Corrective/choppy
Resistance 1 $85,000–$85,150
Resistance 2 $87,300–$87,400
Support 1 $82,700–$83,000
Support 2 $80,500–$81,500
BTC is still above its main averages; one analysis places the 20-day MA near $80,654 and the 50-day MA at $76,466. Daily RSI is around 63, while MACD is still positive but the spread between the lines has started to narrow.
RSI / MACD
RSI ≈63: Positive momentum, but not in an extreme overbought zone.
MACD: Positive, but slowing Histogram means upside momentum is weaker than at the start of the move.
Scenarios
🟢 Bullish
* Clear 4H close above $85,150
* Then reclaim $87,300
* Next technical targets: $88,000 → $90,000
* Invalidate the short-term scenario: back below $82,700
🔴 Bearish
* Break and close 4H below $82,700
* First target: $81,500
* Then $79,900–$80,500
* Losing $79,900 shifts the correction structure to deeper pressure.
Liquidity data indicates that the $82.7K area is very important; breaking it could trigger large liquidations for Longs, while there is offsetting liquidity higher near $84.8K–$88K.
⸻
Ξ Ethereum — ETH
Reference price: about $2,680–$2,700. Latest daily data places ETH around $2,685, while other intraday snapshots recorded $2,652–$2,697.
Trend
Frame Reading
Daily 🟢 Positive
4H 🟡 Correction/weak momentum
Support 1 $2,635–$2,650
Support 2 $2,500–$2,575
Resistance 1 $2,720–$2,740
Resistance 2 $2,800–$2,830
ETH is still above the 50/100/200-day averages, and RSI is around 59; i.e., positive but moderate momentum, not Overbought.
RSI / MACD
RSI ≈59: Buyers still hold momentum, but not enough to treat the breakout as confirmed.
MACD: turned into weak positive / mildly negative in the short term, reflecting loss of part of the momentum after the price failed to hold above $2,700.
Scenarios
🟢 Bullish
* Close 4H above $2,720–$2,740
* Additional confirmation above $2,800
* Targets: $2,830 → $3,000
🔴 Bearish
* Breaks $2,635
* Test $2,575
* Then $2,500
* Losing $2,500 opens the door to testing the $2,400–$2,450 area.
There is also liquidity concentration near $2,700, then $2,740–$2,750, with another zone near $2,620.
⸻
🟡 Binance Coin — BNB
Reference price: about $767. Binance itself shows $767.27 with a 24-hour range of $757.43–$783.41.
Trend
Frame Reading
Daily 🟢 Bullish (medium-term)
4H 🔴 Corrective/neutral
Support 1 $758–$760
Support 2 $747–$750
Resistance 1 $780–$785
Resistance 2 $800–$807
BNB surged strongly from the $700 area to above $800, then entered a correction. The current price is now below some short-term averages, while it remains above the 50- and 200-day averages; one analysis places the 50-day SMA at $705.21 and the 200-day SMA at $635.08.
RSI / MACD
RSI ≈56.6 in one of the latest readings: neutral, slightly leaning positive.
MACD ≈0 / Histogram ≈0: Momentum is currently almost stalled, so there is no strong confirmation of continued upside or a reversal.
Scenarios
🟢 Bullish
* Close 4H above $785
* Confirmation above $800
* Then watch $807+
🔴 Bearish
* Break $758
* First target $750
* Then $735–$747
* Losing $735 increases the chance the correction extends.
The core issue with BNB right now is that the ratio of Long positions is high; one snapshot recorded 67.3% Long alongside a decline in OI—an uncomfortable mix because it suggests the market may be crowded on one side.
⸻
4. ⚡ Derivatives & Liquidity
Asset Open Interest Funding / Positioning Reading
BTC ≈ $55.39B Binance ≈ +0.0053% / 8h Longs are pushing, but not to an extreme
ETH ≈ $34.08B Binance ≈ +0.0097% / 8h Long positioning higher
BNB ≈ $1.30B Relatively crowded Long trend Risk of Long squeeze
Latest CoinGlass data puts BTC OI at around $55.39B, ETH at $34.08B, and BNB at $1.30B.
On the funding level, PerpFinder data at 18:07 UTC showed on Binance:
* BTC: +0.0053% / 8h
* ETH: +0.0097% / 8h.
This means Longs are pushing Shorts, but BTC in this reading doesn’t show a funding-extreme situation; ETH is relatively more expensive for Longs.
As for the overall market, it saw about $330M in liquidations during the last downturn wave.
⸻
5. 🎯 Brief trade map
Asset Bullish Trigger Bearish Trigger Most important watch zone
BTC > $85,150 < $82,700 $82.7K–85.15K
ETH > $2,740 < $2,635 $2.63K–2.74K
BNB > $785 < $758 $758–785
There is no confirmed directional signal inside these zones. Technically, it’s better to wait for a 4H close rather than treat a momentary breakout as a confirmed Breakout.
⸻
🛡️ Today’s risk-management rule
Today’s rule: Don’t risk more than 1% of your capital on a single trade, and don’t enter before a 4H candle closes above/below the crucial level.
Meaning:
BTC: Don’t chase the price between $82.7K and $85.15K.
ETH: Don’t consider $2,700 a real breakout without a clear close.
BNB: Don’t enter inside the $758–$785 range; wait for a confirmed break.
And with rising Open Interest, reducing leverage matters more than expanding the Stop-Loss; because a fast move toward liquidity zones may lead to liquidation before the price gets a chance to return.
Technical conclusion for today
BTC: The daily trend is still positive, but $85K is the key short-term pivot barrier.
ETH: The daily build is positive, but $2,700–$2,740 is the key test zone.
BNB: The bigger trend is bullish, but $758–$785 is the current decision zone.
The most important message from the current data: institutional flows are strong, but derivatives and spot price still haven’t confirmed a new breakout wave; therefore, closing confirmation matters more than predicting direction.
This is an educational market analysis, not a buy or sell recommendation. Crypto and derivatives data constantly change.