#zec #CryptoAlert #TradingAnalysis
🚨 ZEC ALERT ($1,461): It crushed the bullish projections and now breaks support on the 4H chart. Trap or value buy? 📊⚡
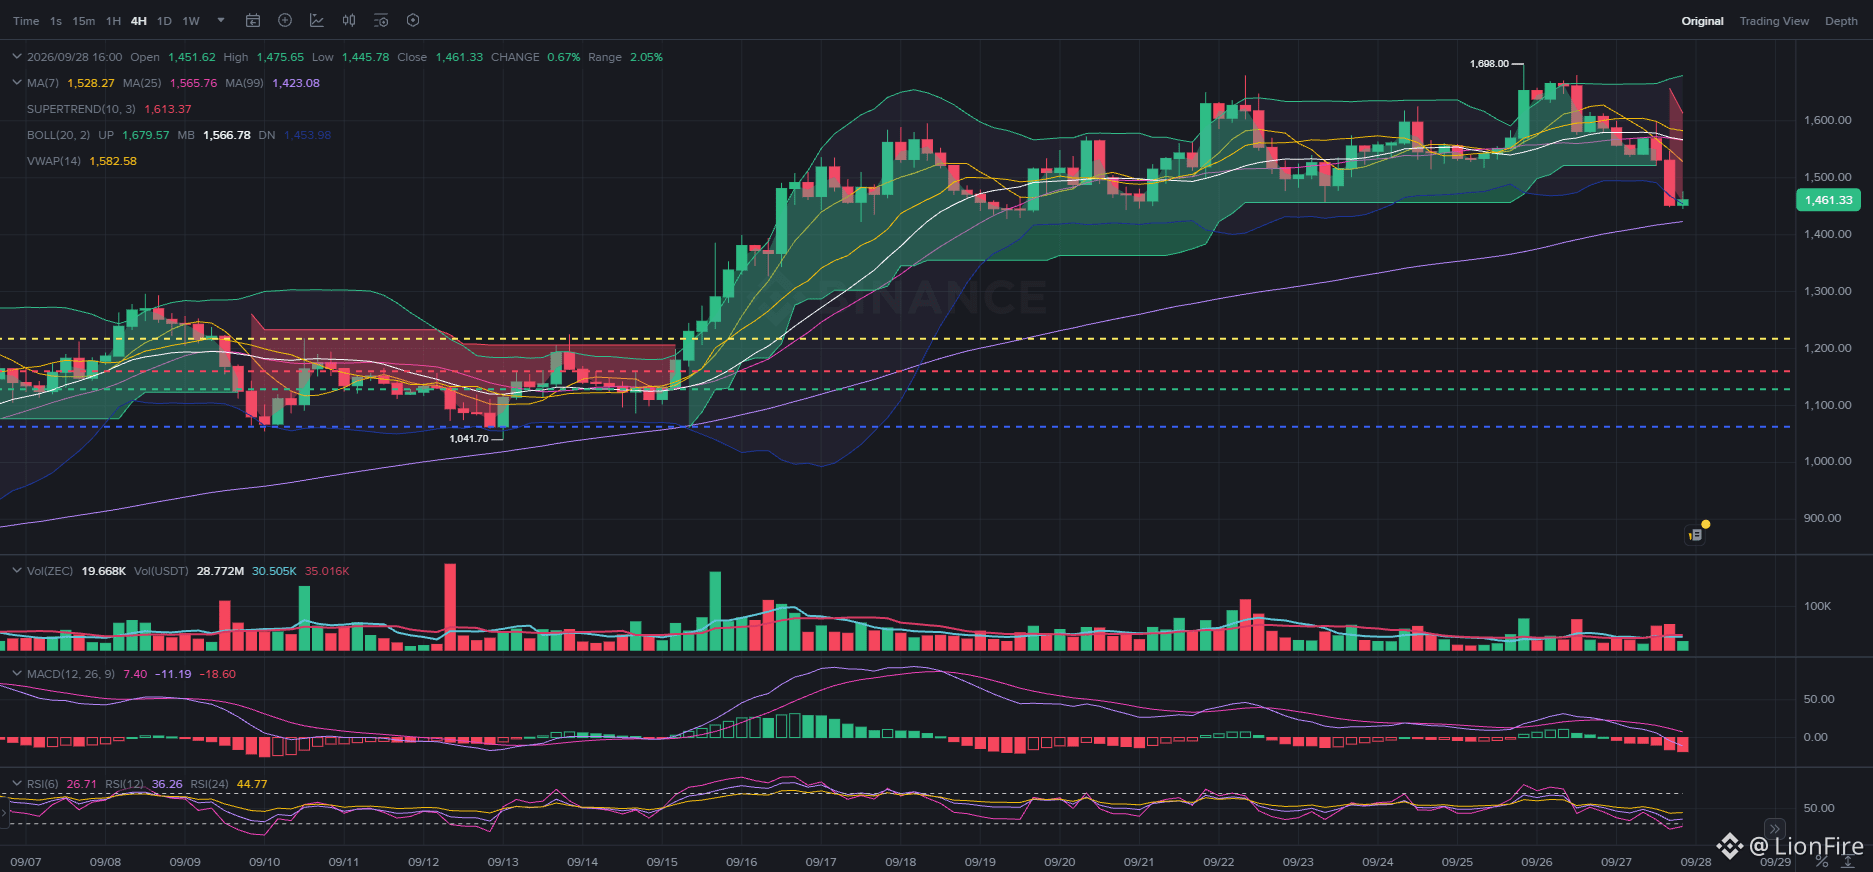
In our previous analysis, we projected a target range of $1,350 – $1,500 for early October. $ZEC ($1,461.33) didn’t just confirm the thesis—it swallowed the bullish scenario by marking a top at $1,698.00 days early. However, after the vertical euphoria, the 4-Hour (4H) chart has just broken its dynamic support.
📉 1. Breaking down the 4H breakdown (4H):
🛑 Short-term reversal: The Supertrend turned red at $1,613.37, confirming aggressive profit-taking after brushing $1,700.
🔻 Loss of fast moving averages: Price pierced the MA7 ($1,528.27), the MA25 ($1,565.76), and the VWAP ($1,582.58), now testing the lower Bollinger band at $1,453.98.
🩸 Oscillator pressure: The MACD histogram deepens into negative territory (-18.60), signaling the loss of immediate buying momentum.
🎯 2. Why this pullback opens a strategic window:
⚡ Extreme oversold: RSI(6) collapsed to 26.71 points. This cooling level hasn’t been seen in weeks and often anticipates technical bounces driven by seller exhaustion.
🛡️ The MA99 cushion: Just below the price action sits the MA99 at $1,423.08, an institutional dynamic support where meaningful buy-side liquidity converges.
💎 Intact potential for a bottom: After a parabolic rally from $1,120, a correction toward the $1,420 – $1,460 zone is the natural breathing space to clean up the order book and allow entries at a better price before structuring the next impulse.
💡 Breaking 4H support scares those who buy at highs, but for the strategic trader it opens an accumulation zone with favorable asymmetry between $1,420 and $1,460. Strict technical stop loss if it loses $1,400 with volume. Keep a cool head and manage risk! 🧠⚡
🚨 ZEC ALERT ($1,461): It crushed the bullish projections and now breaks support on the 4H chart. Trap or value buy? 📊⚡
In our previous analysis, we projected a target range of $1,350 – $1,500 for early October. $ZEC ($1,461.33) didn’t just confirm the thesis—it swallowed the bullish scenario by marking a top at $1,698.00 days early. However, after the vertical euphoria, the 4-Hour (4H) chart has just broken its dynamic support.
📉 1. Breaking down the 4H breakdown (4H):
🛑 Short-term reversal: The Supertrend turned red at $1,613.37, confirming aggressive profit-taking after brushing $1,700.
🔻 Loss of fast moving averages: Price pierced the MA7 ($1,528.27), the MA25 ($1,565.76), and the VWAP ($1,582.58), now testing the lower Bollinger band at $1,453.98.
🩸 Oscillator pressure: The MACD histogram deepens into negative territory (-18.60), signaling the loss of immediate buying momentum.
🎯 2. Why this pullback opens a strategic window:
⚡ Extreme oversold: RSI(6) collapsed to 26.71 points. This cooling level hasn’t been seen in weeks and often anticipates technical bounces driven by seller exhaustion.
🛡️ The MA99 cushion: Just below the price action sits the MA99 at $1,423.08, an institutional dynamic support where meaningful buy-side liquidity converges.
💎 Intact potential for a bottom: After a parabolic rally from $1,120, a correction toward the $1,420 – $1,460 zone is the natural breathing space to clean up the order book and allow entries at a better price before structuring the next impulse.
💡 Breaking 4H support scares those who buy at highs, but for the strategic trader it opens an accumulation zone with favorable asymmetry between $1,420 and $1,460. Strict technical stop loss if it loses $1,400 with volume. Keep a cool head and manage risk! 🧠⚡