$BTC Bitcoin spot ETF weekly net inflow of $2.39 billion🔥
════════════════════
🔴 $BTC Bitcoin spot ETF weekly net inflow of $2.39 billion — slightly bullish in the short term · multi-cycle resonance
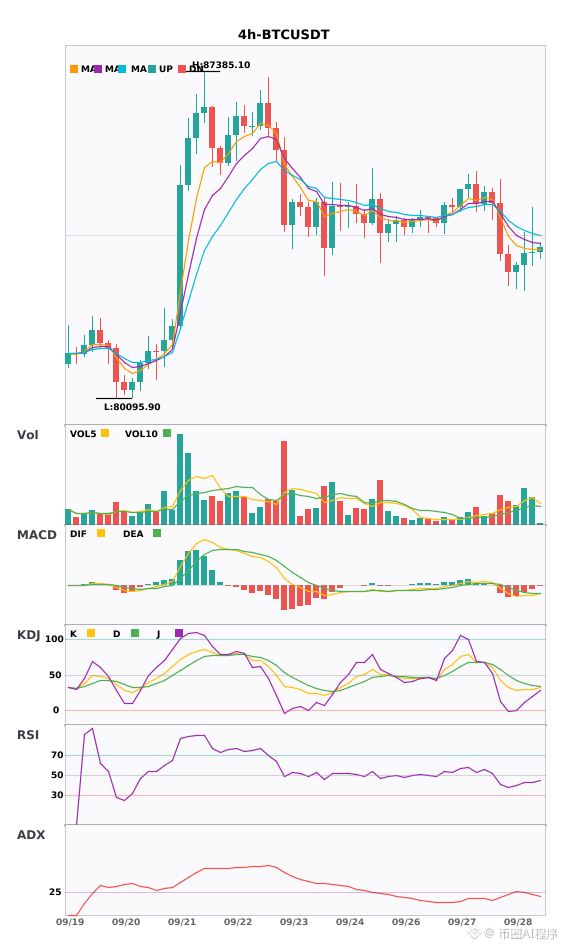
⚠️ Technicals: The daily chart shows a bullish EMA alignment and an ADX of 39.8 indicating a strong trend, but the 4H chart shows a bearish alignment. The directions of the two timeframes do not match—this is a typical case of cycle divergence. The daily timeframe is bullish while the 4H suggests a short-term pullback. Daily support is 74,909, resistance is 87,385. Price at 83,457 is near the upper end of the range. The 4H chart is consolidating with reduced volume, and the MACD histogram’s red bars are converging. As long as the short-term daily bullish structure is not broken, the main strategy remains: pullbacks for long entries.
📢 Market updates: The Bitcoin spot ETF recorded a weekly net inflow of as much as $2.39 billion, with institutional funds continuously moving in. Strategy and Strive added more than 2,700 BTC over the week again. Large players show a strong willingness to accumulate on dips, and the mid-term bullish sentiment remains stable.
════════════════════
🔔 Watch for first-hand market movements and anomalies 🔔
#技术分析 #多周期共振 #Bitcoin spot ETF weekly net inflow of $2.39 billion #BTC
📌 When trading, pay attention to whether the candlestick patterns match
════════════════════
🔴 $BTC Bitcoin spot ETF weekly net inflow of $2.39 billion — slightly bullish in the short term · multi-cycle resonance
⚠️ Technicals: The daily chart shows a bullish EMA alignment and an ADX of 39.8 indicating a strong trend, but the 4H chart shows a bearish alignment. The directions of the two timeframes do not match—this is a typical case of cycle divergence. The daily timeframe is bullish while the 4H suggests a short-term pullback. Daily support is 74,909, resistance is 87,385. Price at 83,457 is near the upper end of the range. The 4H chart is consolidating with reduced volume, and the MACD histogram’s red bars are converging. As long as the short-term daily bullish structure is not broken, the main strategy remains: pullbacks for long entries.
📢 Market updates: The Bitcoin spot ETF recorded a weekly net inflow of as much as $2.39 billion, with institutional funds continuously moving in. Strategy and Strive added more than 2,700 BTC over the week again. Large players show a strong willingness to accumulate on dips, and the mid-term bullish sentiment remains stable.
════════════════════
🔔 Watch for first-hand market movements and anomalies 🔔
#技术分析 #多周期共振 #Bitcoin spot ETF weekly net inflow of $2.39 billion #BTC
📌 When trading, pay attention to whether the candlestick patterns match