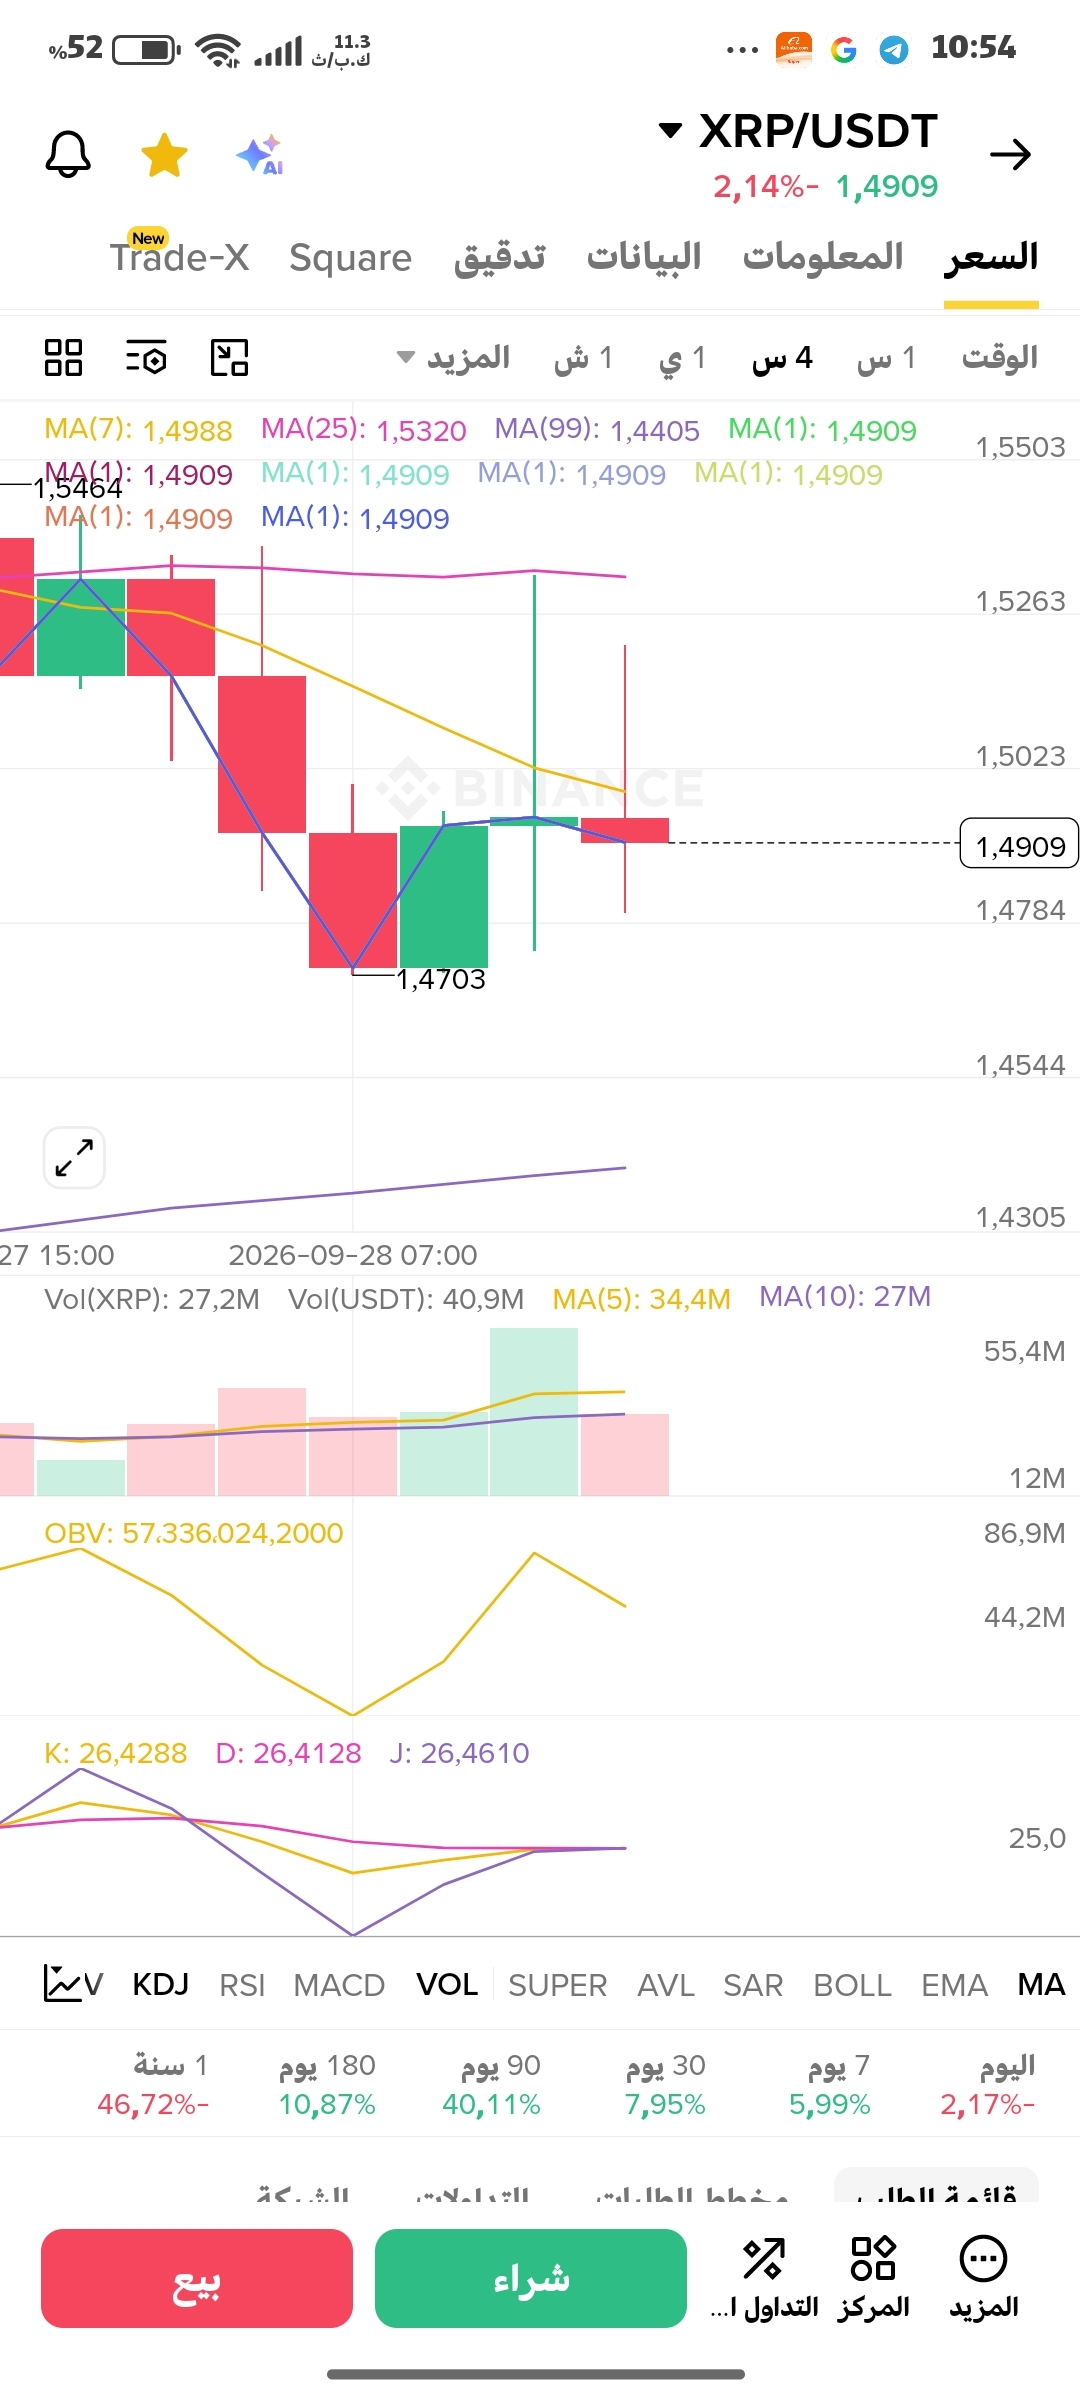
Analysis of XRP pair signals #XRP’ (4-hour frame)
The current chart for the XRP versus USDT coin on the 4-hour timeframe shows the following technical data:
Price movement and moving averages (MA):
The price is currently trading at the $1.4909 level.
The price is below the two short-term moving averages, MA(7) (at 1.4988) and MA(25) (at 1.5320), reflecting short-term selling pressure after the recent drop.
The price is still much higher than the long-term average MA(99) (at 1.4405), indicating that the broader uptrend has not yet broken its main base.
Momentum indicator (KDJ):
The three lines (K, D, J) are at low levels around 26.4.
This proximity to the 25 level or below suggests the asset has entered oversold zones, which often precede an upward corrective rebound or price stabilization.
On-Balance Volume (OBV):
The OBV indicator shows a sharp rise after the price bottom at $1.4703, reflecting the inflow of liquidity and increased buying interest at these low levels that support the price.
The current chart for the XRP versus USDT coin on the 4-hour timeframe shows the following technical data:
Price movement and moving averages (MA):
The price is currently trading at the $1.4909 level.
The price is below the two short-term moving averages, MA(7) (at 1.4988) and MA(25) (at 1.5320), reflecting short-term selling pressure after the recent drop.
The price is still much higher than the long-term average MA(99) (at 1.4405), indicating that the broader uptrend has not yet broken its main base.
Momentum indicator (KDJ):
The three lines (K, D, J) are at low levels around 26.4.
This proximity to the 25 level or below suggests the asset has entered oversold zones, which often precede an upward corrective rebound or price stabilization.
On-Balance Volume (OBV):
The OBV indicator shows a sharp rise after the price bottom at $1.4703, reflecting the inflow of liquidity and increased buying interest at these low levels that support the price.