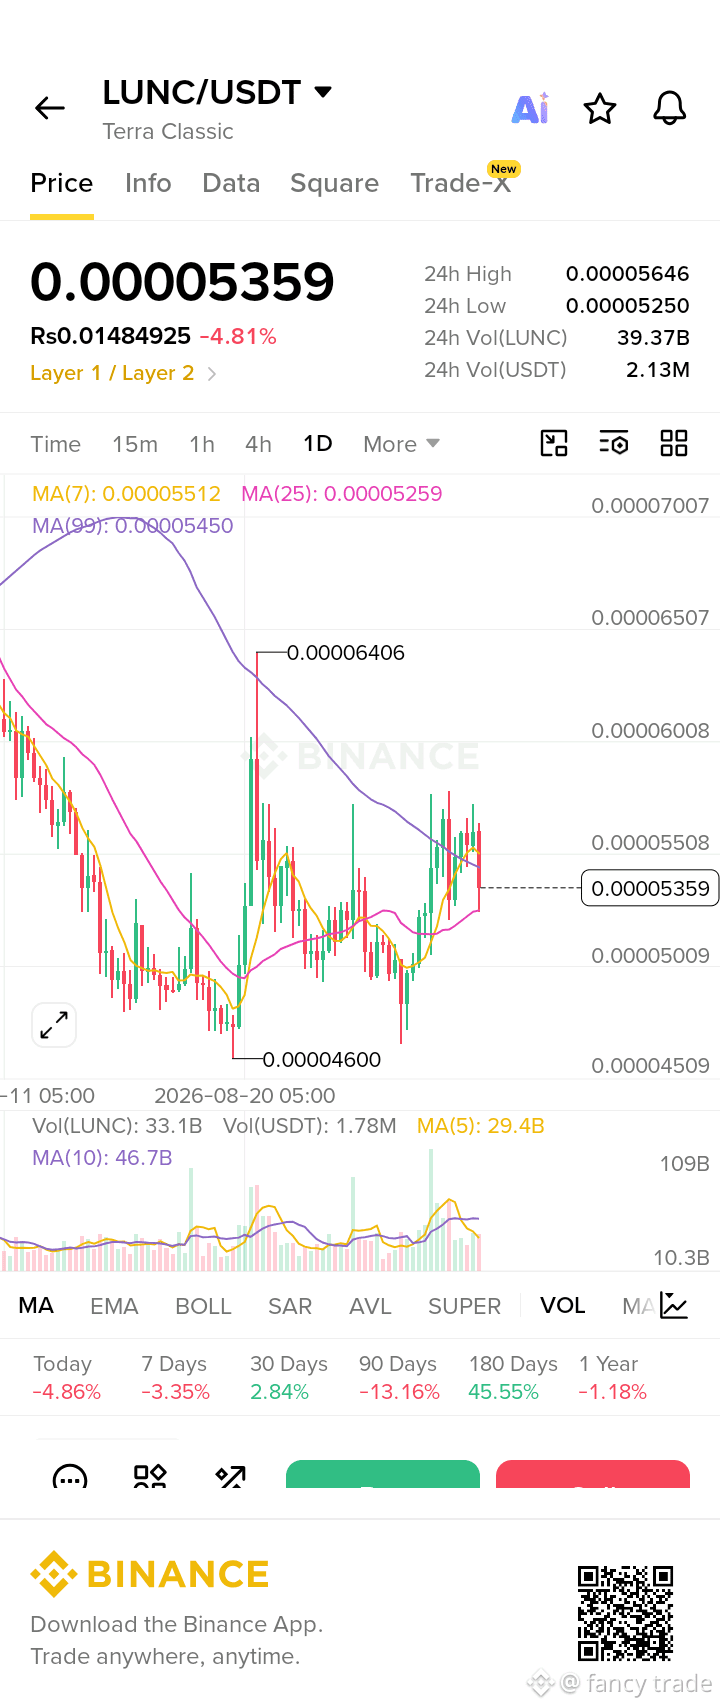
$LUNC /USDT – 1D Chart Analysis
From your chart:
Current price: 0.00005322
MA(7): 0.00005507 → price is below it
MA(25): 0.00005257 → price is slightly above it
MA(99): 0.00005449 → price is below it
24h high/low: 0.00005646 / 0.00005250
📉 Short-term structure: Neutral to slightly bearish. $LUNC recently moved up toward 0.000055–0.0000565 but was rejected and returned to around 0.0000532.
Key levels:
🟢 Support: 0.0000525 → 0.0000500
🟢 Stronger support: 0.0000460
🔴 Resistance: 0.0000545–0.0000555
🔴 Major resistance: 0.0000565
🚀 A daily close above 0.0000565 could indicate stronger upward momentum.
⚠️ A daily close below 0.0000500 would weaken the current structure.The important area now is 0.0000525–0.0000555.
A breakout or breakdown from this range would give a clearer signal than the current price action.
From your chart:
Current price: 0.00005322
MA(7): 0.00005507 → price is below it
MA(25): 0.00005257 → price is slightly above it
MA(99): 0.00005449 → price is below it
24h high/low: 0.00005646 / 0.00005250
📉 Short-term structure: Neutral to slightly bearish. $LUNC recently moved up toward 0.000055–0.0000565 but was rejected and returned to around 0.0000532.
Key levels:
🟢 Support: 0.0000525 → 0.0000500
🟢 Stronger support: 0.0000460
🔴 Resistance: 0.0000545–0.0000555
🔴 Major resistance: 0.0000565
🚀 A daily close above 0.0000565 could indicate stronger upward momentum.
⚠️ A daily close below 0.0000500 would weaken the current structure.The important area now is 0.0000525–0.0000555.
A breakout or breakdown from this range would give a clearer signal than the current price action.