$ETH Ethereum circle academician: 9.29 ETH range convergence—building up energy for an imminent directional breakout? Latest market analysis reference
At the current Ethereum price of 2670, the biggest taboo in this market is going heavily long and betting on a one-way breakout. A bullish outlook on the higher timeframe doesn’t mean prices will rise immediately on the short term. Pay attention to the decaying signals from the indicators. In a range-bound market, profits are thin—don’t get stuck in a trade; exit once you reach your target. If the market breaks out of this range box, immediately switch your thinking and don’t cling to the previous range-bound mindset.
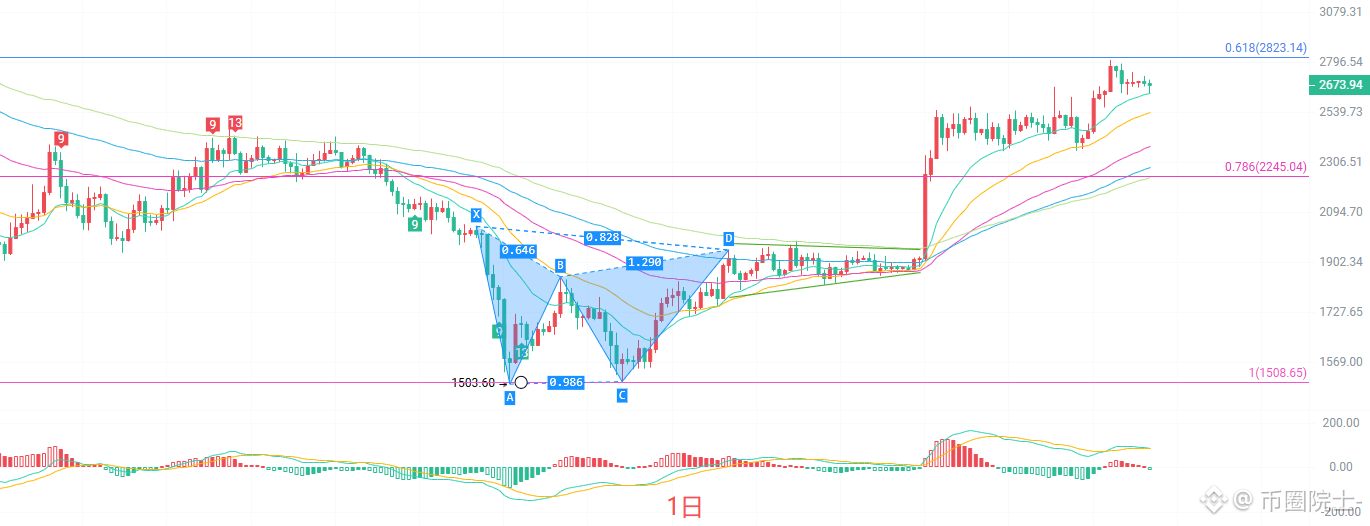
The daily K-line remains above both the EMA15 and EMA30, and the mid-term bullish structure has not been broken. The Bollinger Band midline at 2585 forms a strong support, while the upper band at 2820 caps the price. The MACD red histogram continues to narrow; DIF and DEA are still above the zero line, but upward momentum is slowing down. This suggests the market is in a high-level consolidation phase after an upswing. The prior high at 2806 is the key resistance for this leg higher—if it cannot break effectively, a phase of pullback is likely. If price holds above it, the bullish room to move can reopen.
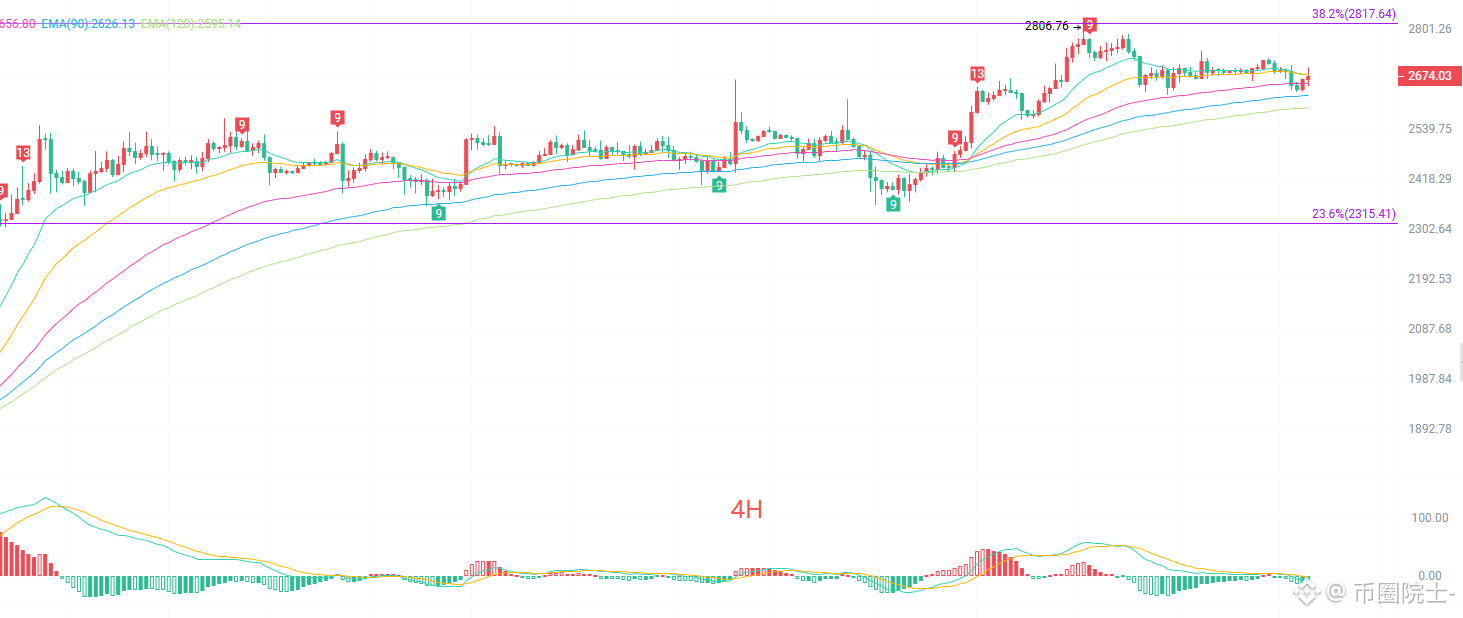
On the four-hour chart, the short-term EMA15 and EMA30 are intertwined and flat, and the moving averages have shifted from a steep rise to horizontal consolidation, indicating insufficient short-term bullish strength. Bollinger upper band is 2722 and lower band is 2650; price is trading near the Bollinger midline, showing clear range-trading characteristics. In the MACD indicator, DIF crosses below DEA, and the green histogram slightly expands—short-term weakness is emerging. Overhead pressure is 2700–2722, the first support is 2650, and stronger support lies at the EMA60 around 2656. For now, there is no one-way trend on the short cycle; choppy back-and-forth consolidation is the main tone.
Short-term reference:
If price breaks down northbound from 2650 to 2610, cut losses at 40 points; target 2720 to 2760.
If price from 2750 to 2770 does not break, go short southbound; cut losses at 40 points; target 2700 to 2660.
Specific execution should rely on real-time order book data. For more information, you can consult the author—note that the article has a publishing delay. This is for reference only; risk is yours to bear.
#ETH走势分析 #ETH(二饼)
At the current Ethereum price of 2670, the biggest taboo in this market is going heavily long and betting on a one-way breakout. A bullish outlook on the higher timeframe doesn’t mean prices will rise immediately on the short term. Pay attention to the decaying signals from the indicators. In a range-bound market, profits are thin—don’t get stuck in a trade; exit once you reach your target. If the market breaks out of this range box, immediately switch your thinking and don’t cling to the previous range-bound mindset.
The daily K-line remains above both the EMA15 and EMA30, and the mid-term bullish structure has not been broken. The Bollinger Band midline at 2585 forms a strong support, while the upper band at 2820 caps the price. The MACD red histogram continues to narrow; DIF and DEA are still above the zero line, but upward momentum is slowing down. This suggests the market is in a high-level consolidation phase after an upswing. The prior high at 2806 is the key resistance for this leg higher—if it cannot break effectively, a phase of pullback is likely. If price holds above it, the bullish room to move can reopen.
On the four-hour chart, the short-term EMA15 and EMA30 are intertwined and flat, and the moving averages have shifted from a steep rise to horizontal consolidation, indicating insufficient short-term bullish strength. Bollinger upper band is 2722 and lower band is 2650; price is trading near the Bollinger midline, showing clear range-trading characteristics. In the MACD indicator, DIF crosses below DEA, and the green histogram slightly expands—short-term weakness is emerging. Overhead pressure is 2700–2722, the first support is 2650, and stronger support lies at the EMA60 around 2656. For now, there is no one-way trend on the short cycle; choppy back-and-forth consolidation is the main tone.
Short-term reference:
If price breaks down northbound from 2650 to 2610, cut losses at 40 points; target 2720 to 2760.
If price from 2750 to 2770 does not break, go short southbound; cut losses at 40 points; target 2700 to 2660.
Specific execution should rely on real-time order book data. For more information, you can consult the author—note that the article has a publishing delay. This is for reference only; risk is yours to bear.
#ETH走势分析 #ETH(二饼)