




Processing took 15s
SPCX/USDT — analysis...
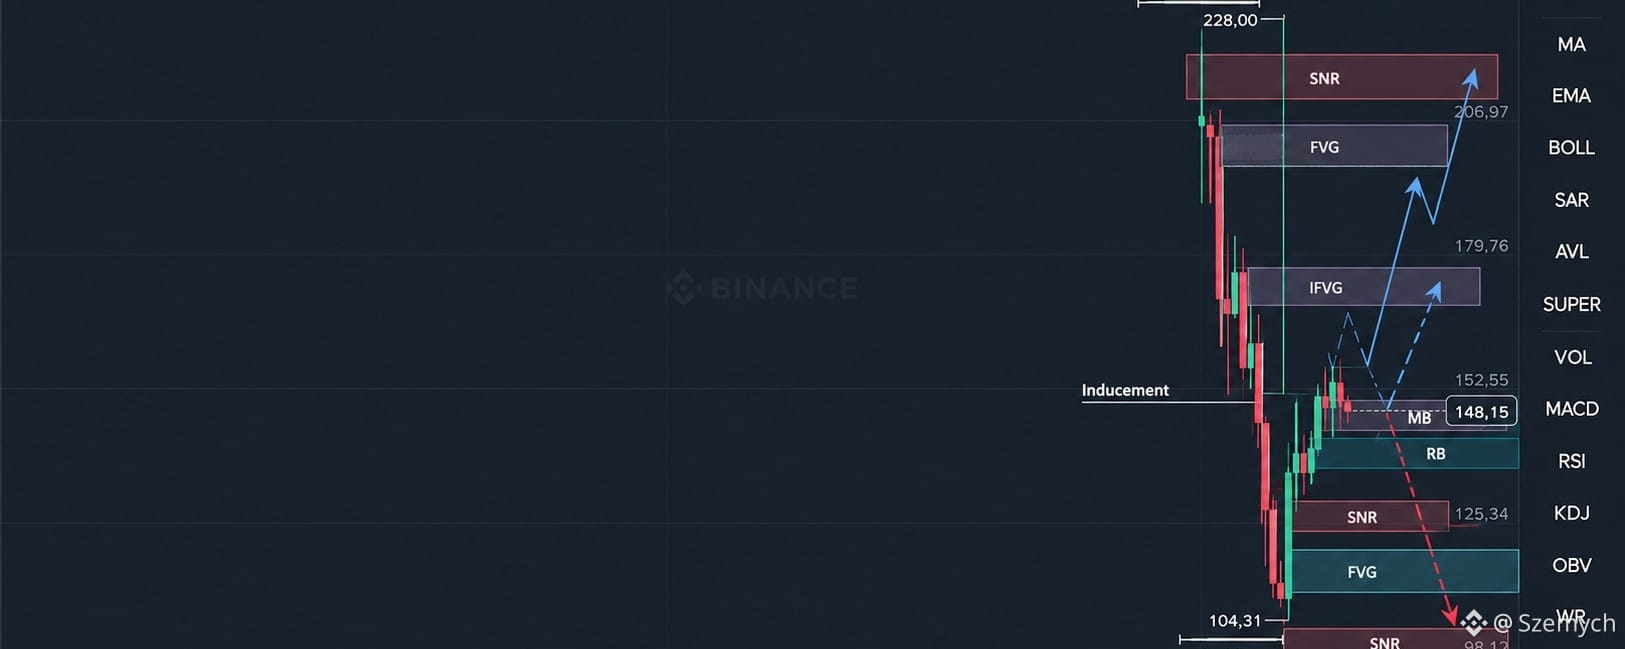
On the charts, the structure is read quite well. The current price around 147.85–148.15 is after a strong impulsive move, followed by a liquidity sweep down to 145.29 and a return back into the 147–149 area.
> Analysis is built specifically based on the structure in your charts; the levels are working zones, not guaranteed reversal points.
1. HTF — main structure
On the higher chart, you can see that: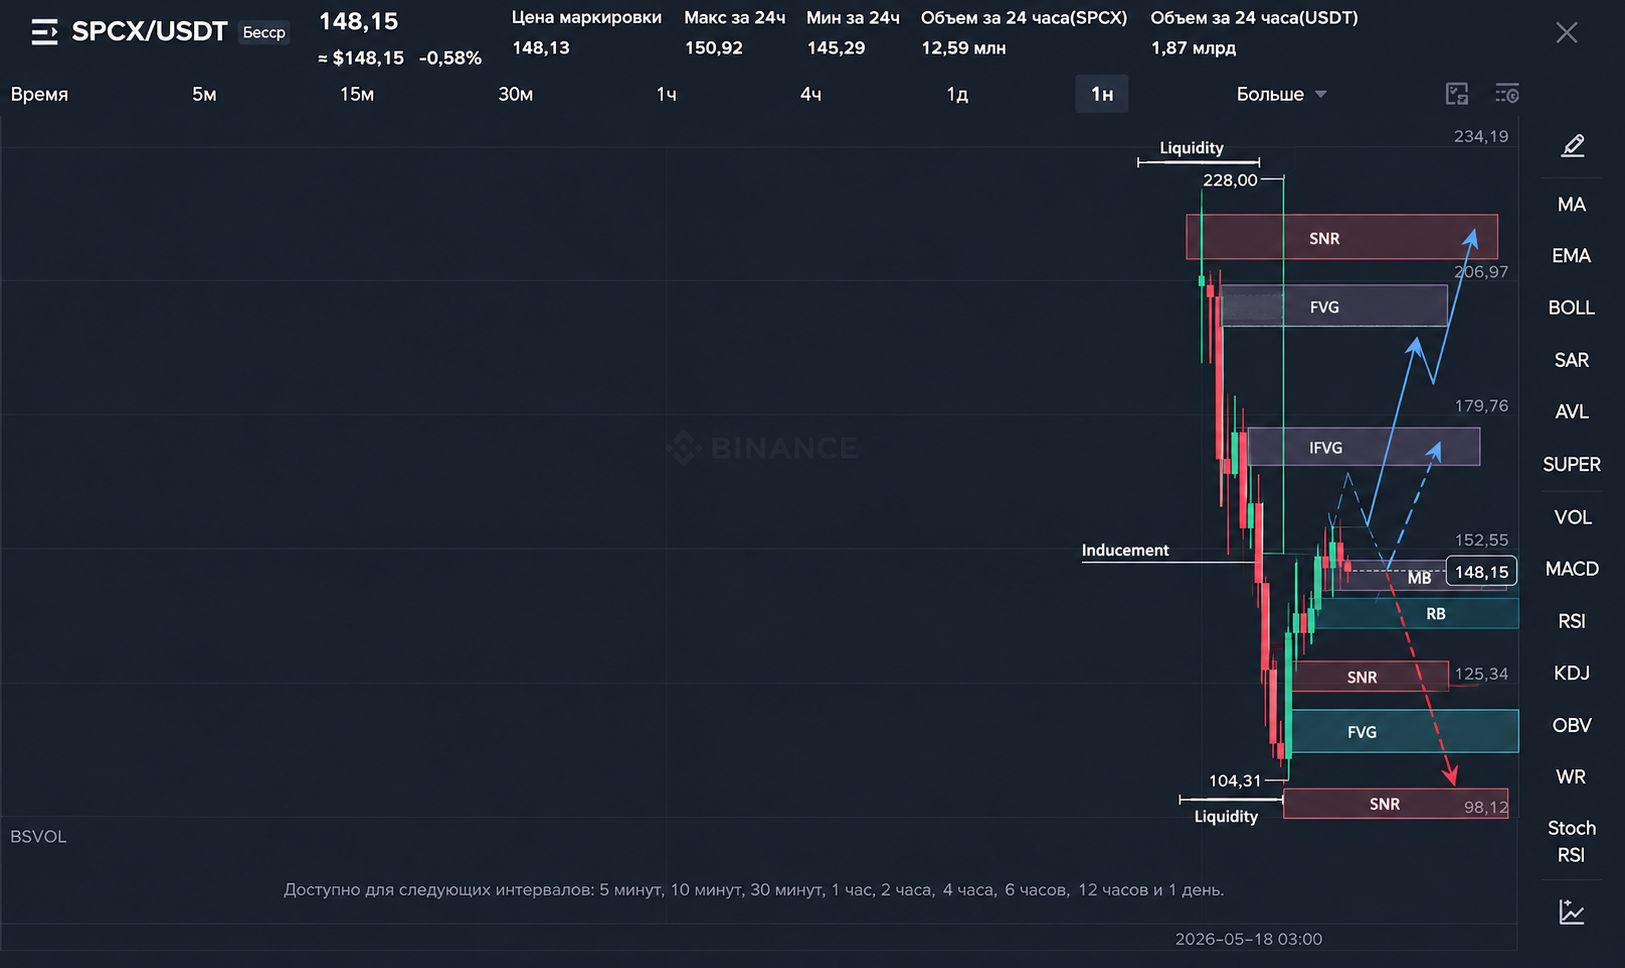
major high: 228.00
major low: 104.31
after the drop from 228, the market formed a strong base around 104–110;
then there was a clear bullish displacement;
price returned to the 145–158 area where balance is currently forming.
Main HTF range: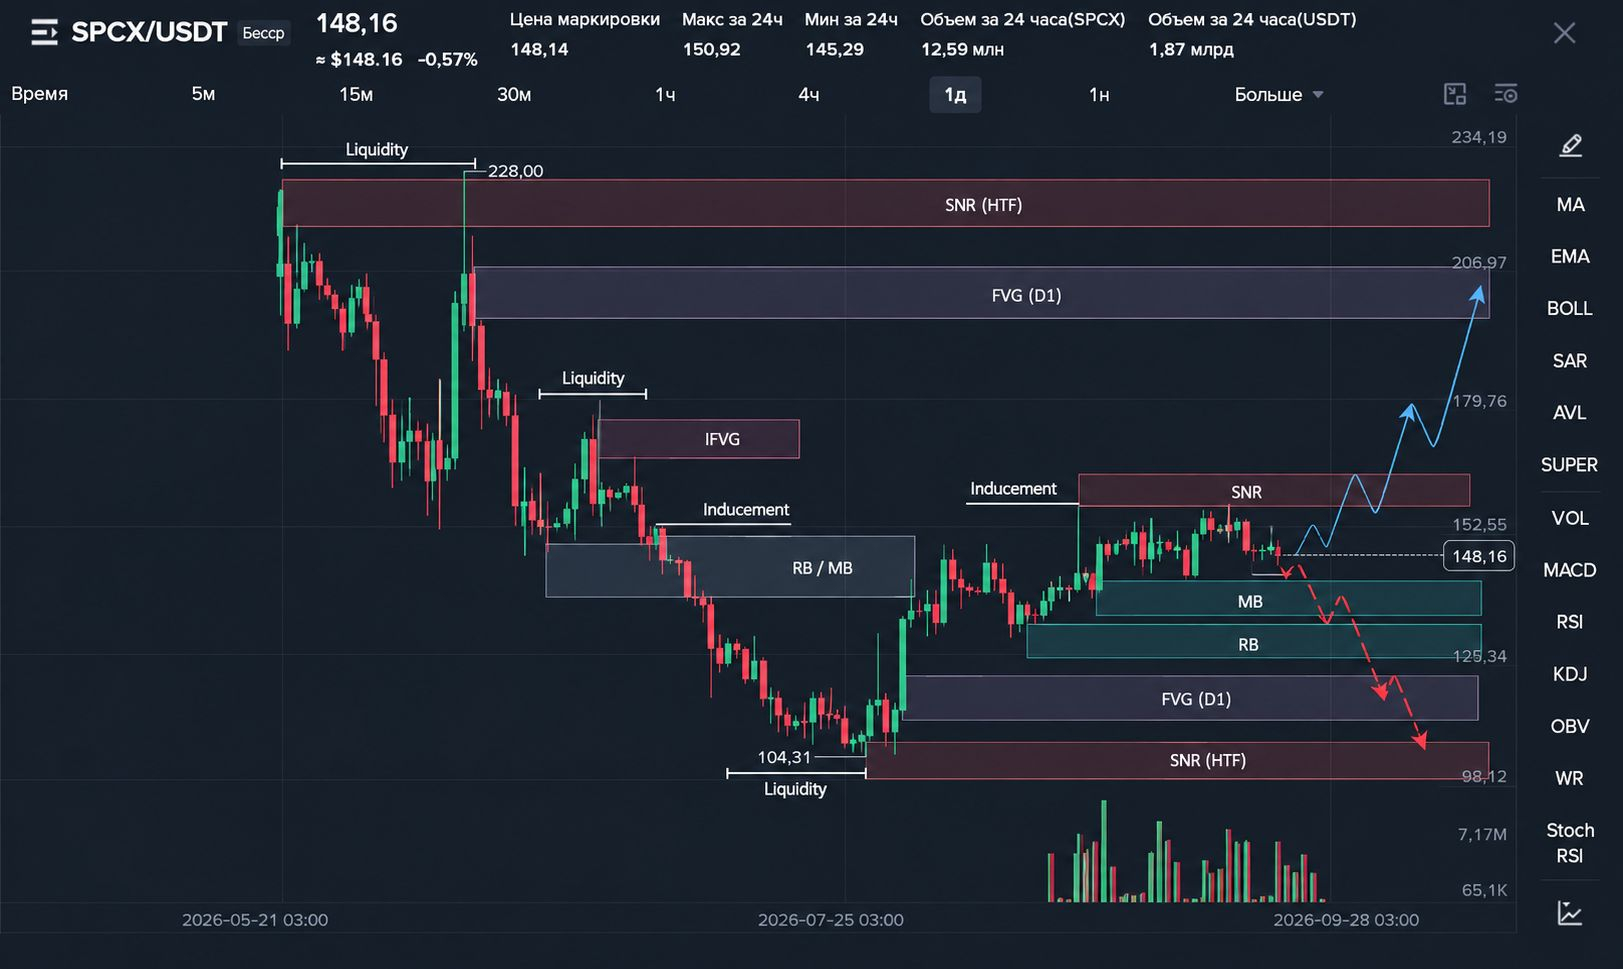
104.31 → 228.00
The current price is approximately in the middle/upper part of the last local recovery range.
Key resistance zone
150.50–153.00
Here is a series of local highs and the zone from which price repeatedly reacted.
Above:
154.80–158.25
This is already a meaningful buy-side liquidity:
158.24 — a local swing high;
158.24–160 — the area of potential liquidity removal.
---
2. What happened from the Liquidity point of view
The most interesting move is on the lower timeframes.
Price first formed a local range: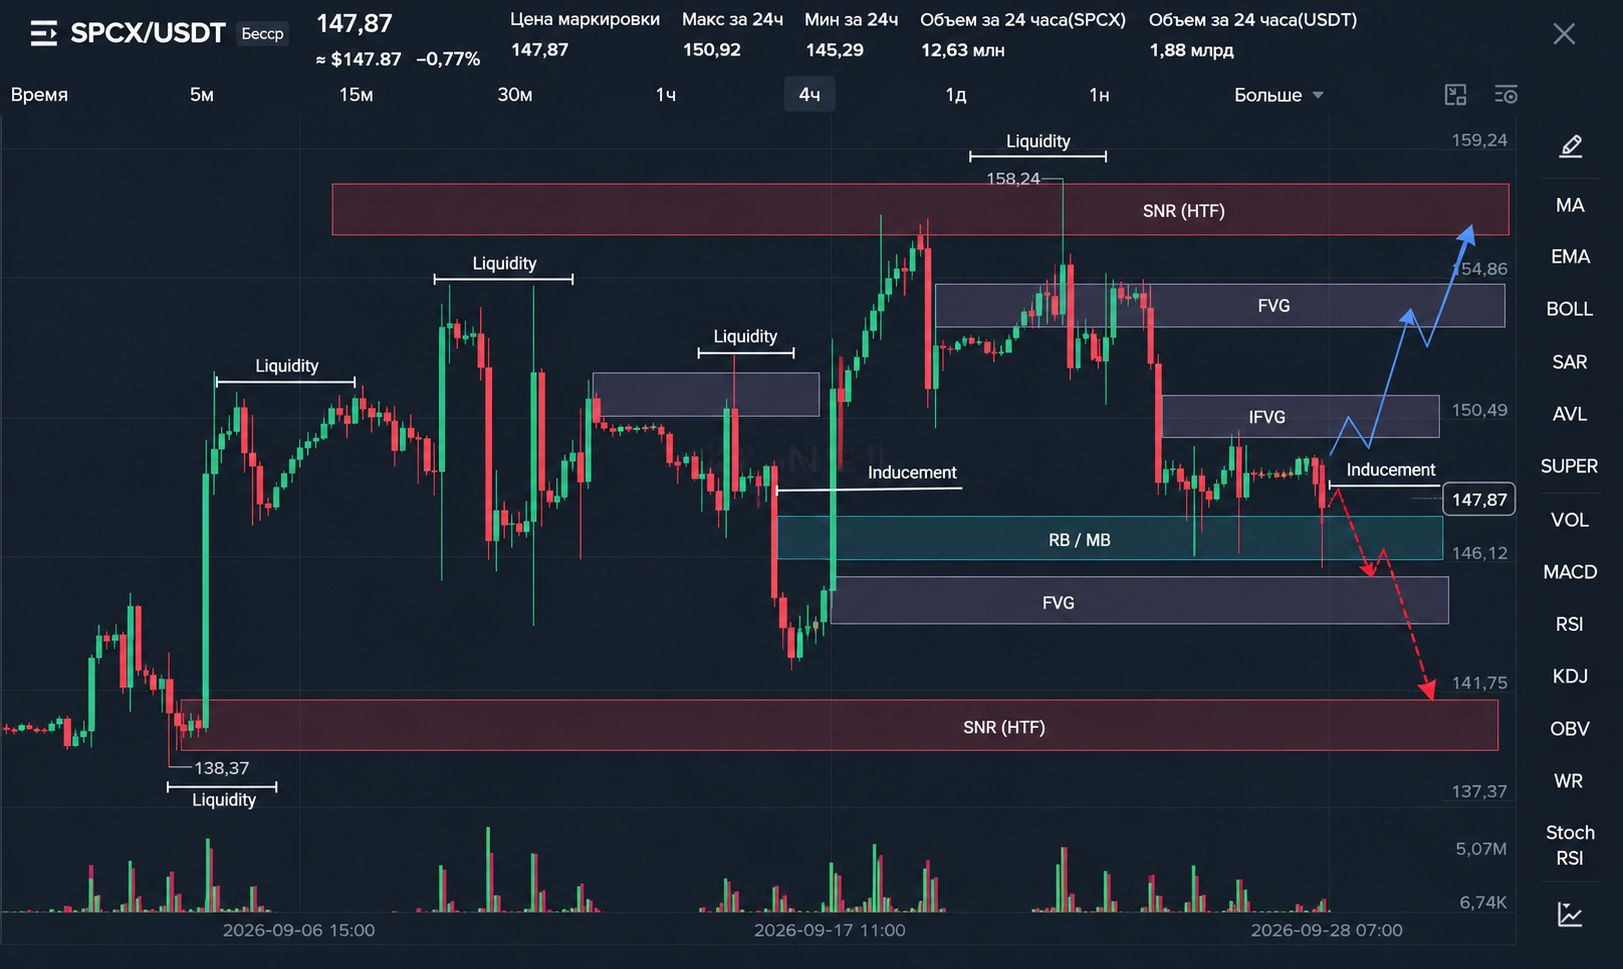
approximately 148.7–150.9
Then there was a sweep out:
150.92 → 145.29
Moreover, the move was accompanied by a sharp increase in volume.
This is a very important element of the structure:
Liquidity → displacement → return to value.
That is, the seller got the opportunity to push price below the local range, after which price began returning above.
145.29
I consider 145.29 as the key sell-side liquidity that has already been taken.
Therefore, finding price again above this area changes the character of the scenario:
145.29 sweep → reclaim → potential delivery upward.
But for full bullish confirmation, control over 148.70–149.00 is needed and then a break of 150.50–150.92.
---
3. SNR
Main SNR
145.29–146.25
Lower reaction zone after a liquidity sweep.
147.40–147.90
Current balance area.
148.70–149.00
The nearest SNR that now should become support for continuation upward.
150.30–150.95
Key resistance.
152.50–153.20
Next sell-side reaction zone.
154.80–158.25
HTF resistance + liquidity.
---
4. FVG / IFVG
On 1H/15M, after a sharp drop, an inefficiency zone formed around the 149–150+ area.
The logic here is the following: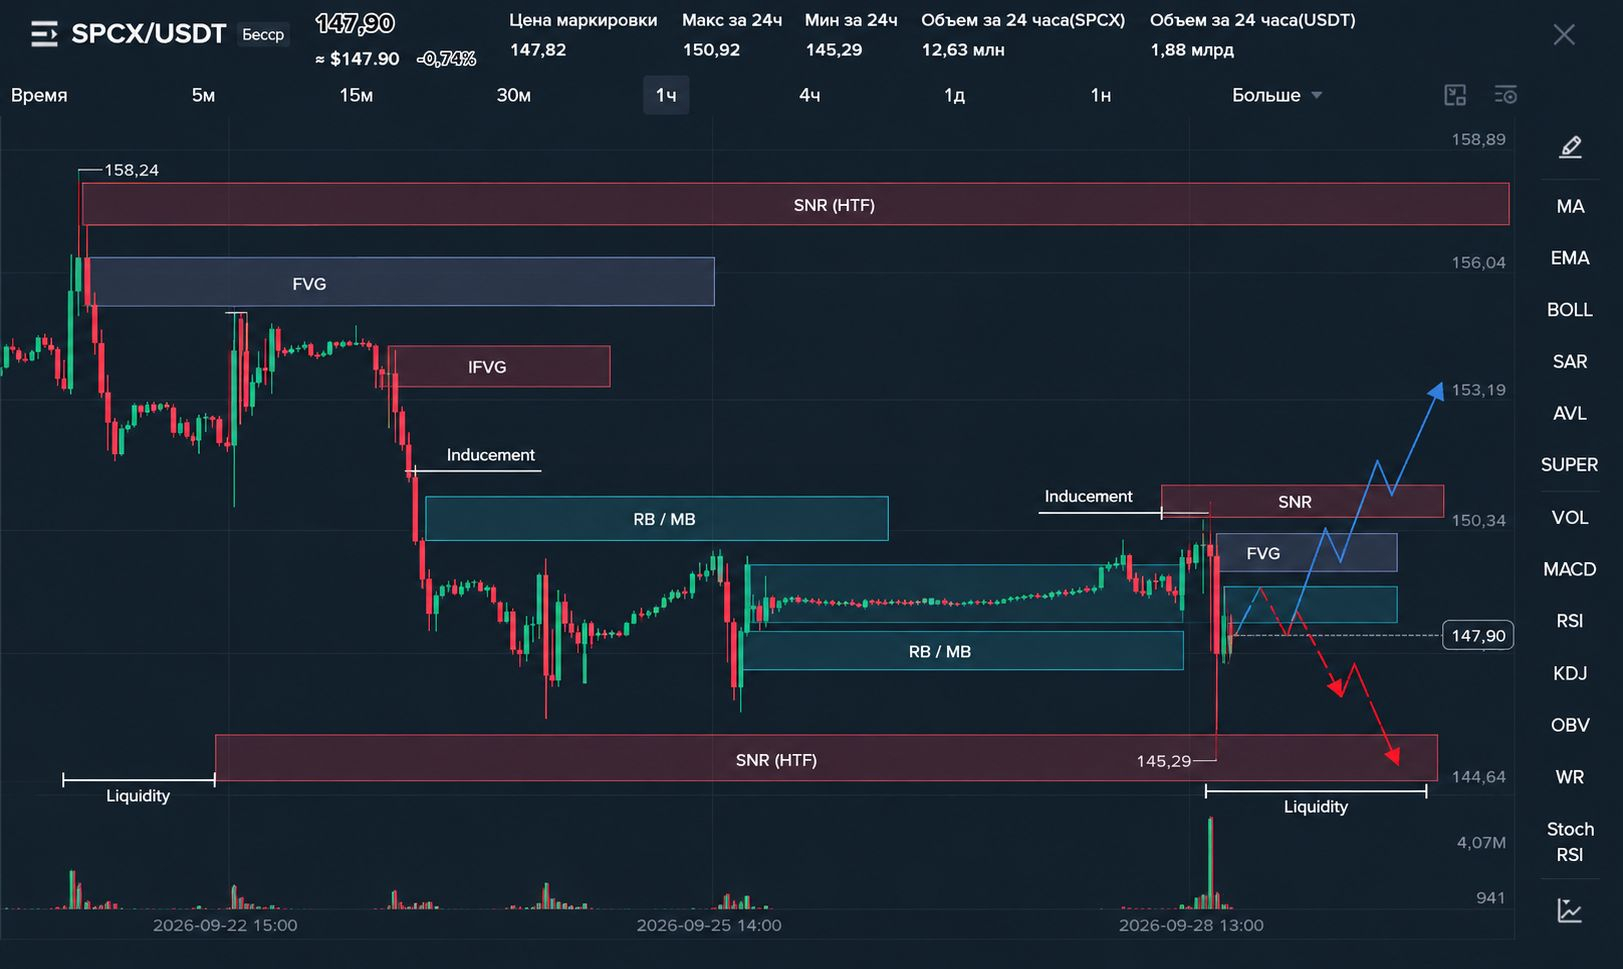
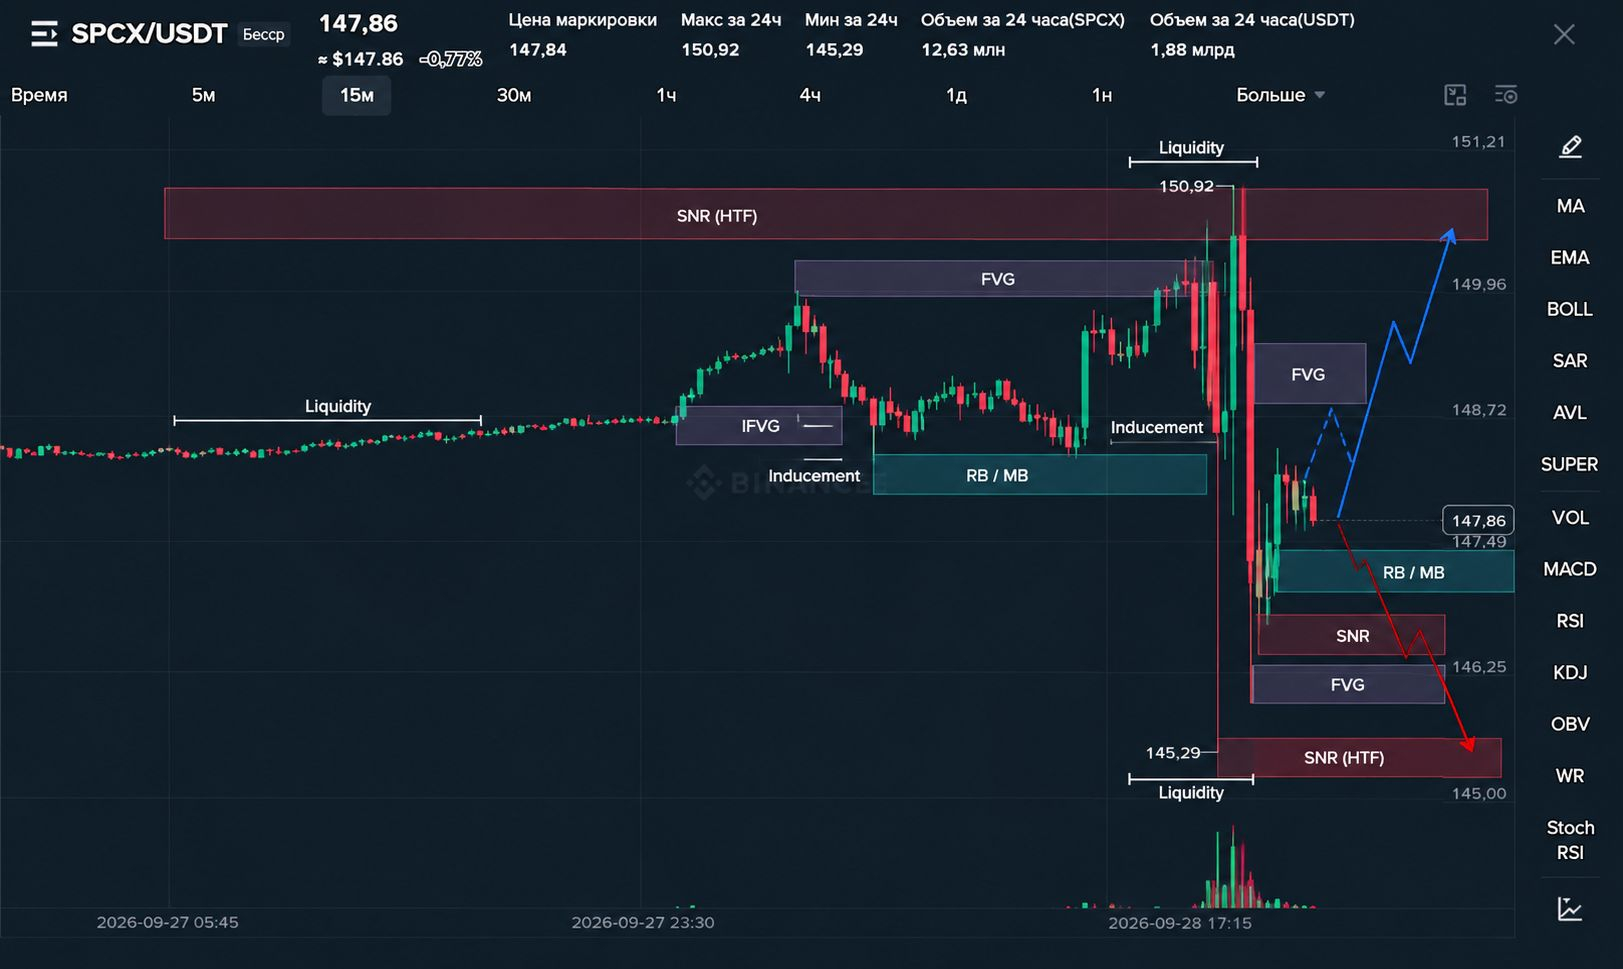
downward displacement → FVG → price returning into the FVG → reaction.
Therefore the zone is approximately:
149.0–150.0
need to consider it as an important decision zone.
If price returns there and gets rejection — the seller keeps control.
If price is accepted above the zone, the FVG can shift into the role of IFVG/support, after which the next delivery becomes:
150 → 152.5 → 154.8 → 158.2.
---
5. Inducement
On the lower timeframe, I would highlight a local range:
147.40–148.70
as a potential inducement zone.
After 145.29 was taken, price returned inside the range and is now creating a series of small local highs/lows.
A false signal may appear right here:
upward move → local breakout → return below 148 → continuation down.
So I wouldn’t consider entering just on a touch of 148–149 as a proper SzemychGPT signal.
Need a reaction of the structure.
---
6. RB / MB
Bullish RB
The area around:
145.3–146.3
After the sharp move down, price formed a base and an impulsive return followed it.
This is the most interesting zone for the scenario:
SSL sweep → RB → displacement → continuation.
But retesting this zone without a reaction would weaken it.
MB
A local balance has formed approximately:
147.4–149.0
Exactly here the redistribution is happening right now.
If price stays inside this area for a long time, it’s better to wait for an exit from the MB rather than trade its middle.
---
7. Price delivery logic
At the moment I see two sequences.
Scenario A — bullish delivery
145.29
↓
SSL RAID
↓
145.3–146.3 RB
↓
147.4–149 MB
↓
149–150 FVG / IFVG
↓
150.9 liquidity
↓
152.5
↓
154.8
↓
158.2
Key idea:
first the sell-side was taken, then price returned into the range.
For this scenario to continue, acceptance above 149–150 is required.
---
Scenario B — bearish continuation
If price can’t hold above 149–150:
147.8
↓
148.7–150 rejection
↓
147.4
↓
146.25
↓
145.29
↓
SSL below 145.29
And if 145.29 is broken and price closes below, then the previous liquidity sweep stops looking like a full bullish reversal and turns into a normal retracement before further downside continuation.
---
8. Entry points:
I wouldn’t use a market entry right at 147.85.
🟢 Long #1 — aggressive
145.3–146.3
Conditions:
1. another entry into RB;
2. taking local sell-side liquidity;
3. bullish displacement on 5M;
4. formation of FVG;
5. return to FVG/IFVG;
6. entry after confirmation.
Targets:
148.7 → 150.0 → 150.9 → 152.5
---
🟢 Long #2 — confirmation
Wait:
break + displacement above 149.0–149.5
Then:
retest FVG/IFVG
and only after holding the zone, look for continuation.
Targets:
150.9 → 152.5 → 154.8
---
🔴 Short
The main short-zone:
150.5–153.0
But not just a limit sell.
We need a sequence:
BSL raid → rejection → bearish displacement → FVG → retest → short.
Targets:
148.7 → 147.4 → 146.25 → 145.29.
---
9. What is currently most important on 5M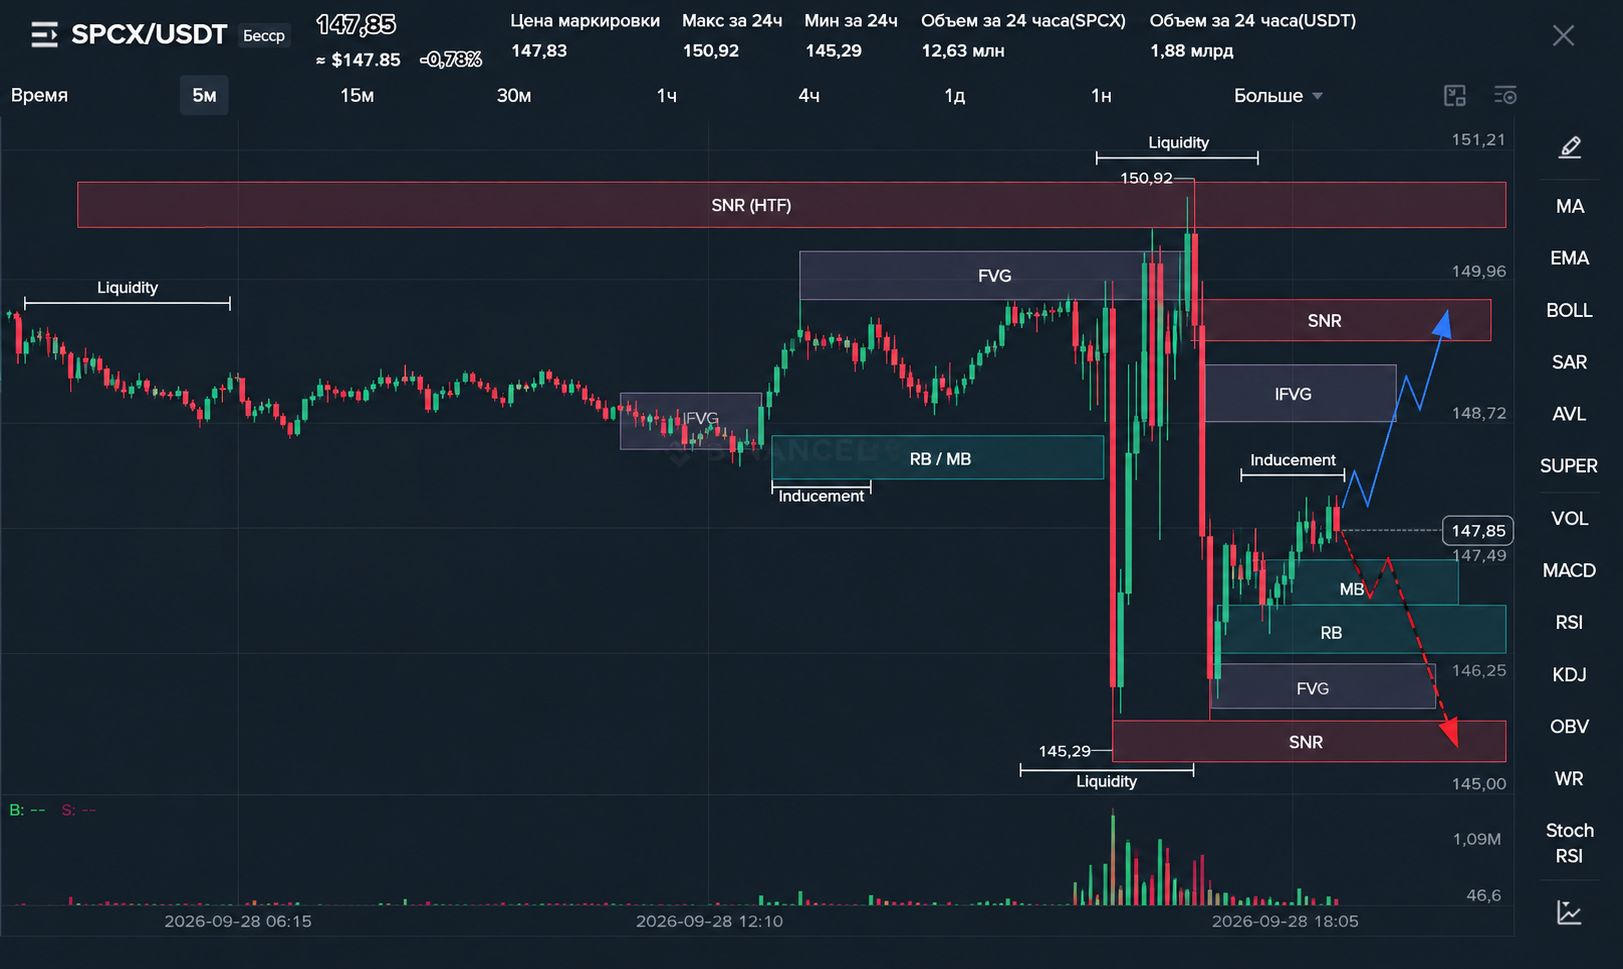
The last chart shows a very characteristic picture:
150.92 → 145.29 → quick return → consolidation around 147.5–148.0.
So the market has already done strong liquidity work.
Right now I would watch four levels:
Level Role
145.29 SSL / key invalidation
146.25 intermediate support
148.70–149.00 local SNR / pivot
150.50–150.92 BSL + main resistance
---
Conclusion:
HTF: recovery after an extreme drop, but price hit a local supply zone.
Liquidity:
145.29 SSL is already taken
150.92 BSL stays on top
Inducement: 147.4–148.7
RB: 145.3–146.3
MB: 147.4–149.0
FVG/IFVG: reference 149–150
Resistance: 150.5–153.0
HTF resistance: 154.8–158.25
The main logic:
If 145.29 holds → the market has a reason to continue delivering upward toward 150.9 and higher.
If 149–150 gives rejection → a reverse delivery to 147.4 / 146.25 / 145.29 is likely.
If 145.29 is convincingly lost → the bullish scenario of the current sweep is cancelled.$SPCX